.webp)
Key takeaways:
Supply chain network optimization sounds like something only a national chain does. The underlying question is smaller than the phrase suggests: are you buying the right things, from the right suppliers, delivered on the right days, at the lowest total cost that still keeps your kitchen running?
Most restaurants answer that question once, when they open, and never revisit it. Suppliers accumulate, delivery days multiply, and nobody recalculates whether the arrangement still makes sense three years later.
This guide covers what network optimization actually involves, which parts of it apply at restaurant scale, and how to reduce costs through supply chain network optimization without risking a short delivery on a Saturday.
Supply chain network optimization is the practice of designing where inventory is sourced, stored, and shipped from so that total cost is as low as possible for a given service level. It treats the supply chain as a network of nodes and routes, then tests alternative arrangements against real constraints.
Supply chain network analysis and optimization work through three levers: location, allocation, and flow. Location asks where facilities should sit. Allocation asks which sites each facility serves. Flow asks how much moves along each route and how often.
For a manufacturer those questions concern plants and warehouses, which is the classic supply chain distribution network optimization problem. For a restaurant group they concern distributors, delivery frequency, and which locations share a supplier.
The word "optimization" implies a mathematical answer, and at large scale it genuinely is one. At restaurant scale the useful version is closer to structured comparison than to solving equations.
Restaurants do not own warehouses or trucks, so it is tempting to assume network design is somebody else's job. What you do own is the set of choices that determine your delivered cost.
| Network decision | What a restaurant controls | Cost it drives |
|---|---|---|
| Sourcing | Which distributors and specialty suppliers you use | Unit price, rebates, minimum order value |
| Allocation | Which sites buy from which supplier | Consistency, volume leverage, pricing tier |
| Delivery frequency | How many drops per week per supplier | Delivery fees, labor to receive, waste |
| Order timing | Cutoffs and which days you order | Fill rate, emergency top-ups, short deliveries |
| Consolidation | How many suppliers cover the same categories | Admin time, invoice volume, price comparison |
Each row is a decision most operators made informally and have not revisited. A group that added locations one at a time usually has each site buying independently, which quietly forfeits the volume leverage the group has earned.
Categories with lot-tracking requirements add another constraint, since food traceability obligations follow the product through whichever network you design. Delivery frequency is the row with the fastest payback. Every extra drop costs a delivery fee, twenty minutes of someone's shift to receive and check it, and another invoice to process.
Formal supply chain network optimization models are worth understanding even if you never run one, because they explain what the software is doing and where its answers come from.
| Model | What it answers | Restaurant relevance |
|---|---|---|
| Center of gravity | Where to place a facility to minimize weighted distance | Low, unless you run a commissary |
| Mixed-integer linear programming | Which combination of sites and routes minimizes total cost | Used inside optimization software |
| Simulation | How the network behaves under variability and disruption | Useful for stress-testing supplier failure |
| Scenario comparison | Which of several defined arrangements costs least | The practical method at restaurant scale |
The first three require data most restaurants do not have and a specialist to run them. The fourth is a spreadsheet exercise and delivers most of the benefit for an operator with fewer than twenty sites.
Scenario comparison works because the realistic options are few. You are usually choosing between two or three distributors, and between two, three, or four deliveries a week, which is a small enough space to evaluate by hand.
Optimizing a network against average price inflation misses the point, because food prices do not move together.
USDA Economic Research Service data shows food-at-home prices rose 2.3% in 2025 compared with 2024, slightly below the 20-year average of 2.6% a year. The category detail tells a different story.
Egg prices averaged 21.9% higher in 2025 than 2024 even after falling steadily from April onward. Beef and veal rose 11.6%, sugar and sweets 5.1%, and nonalcoholic beverages 3.8%.
Set against the headline number, the categories that matter are not close to it.
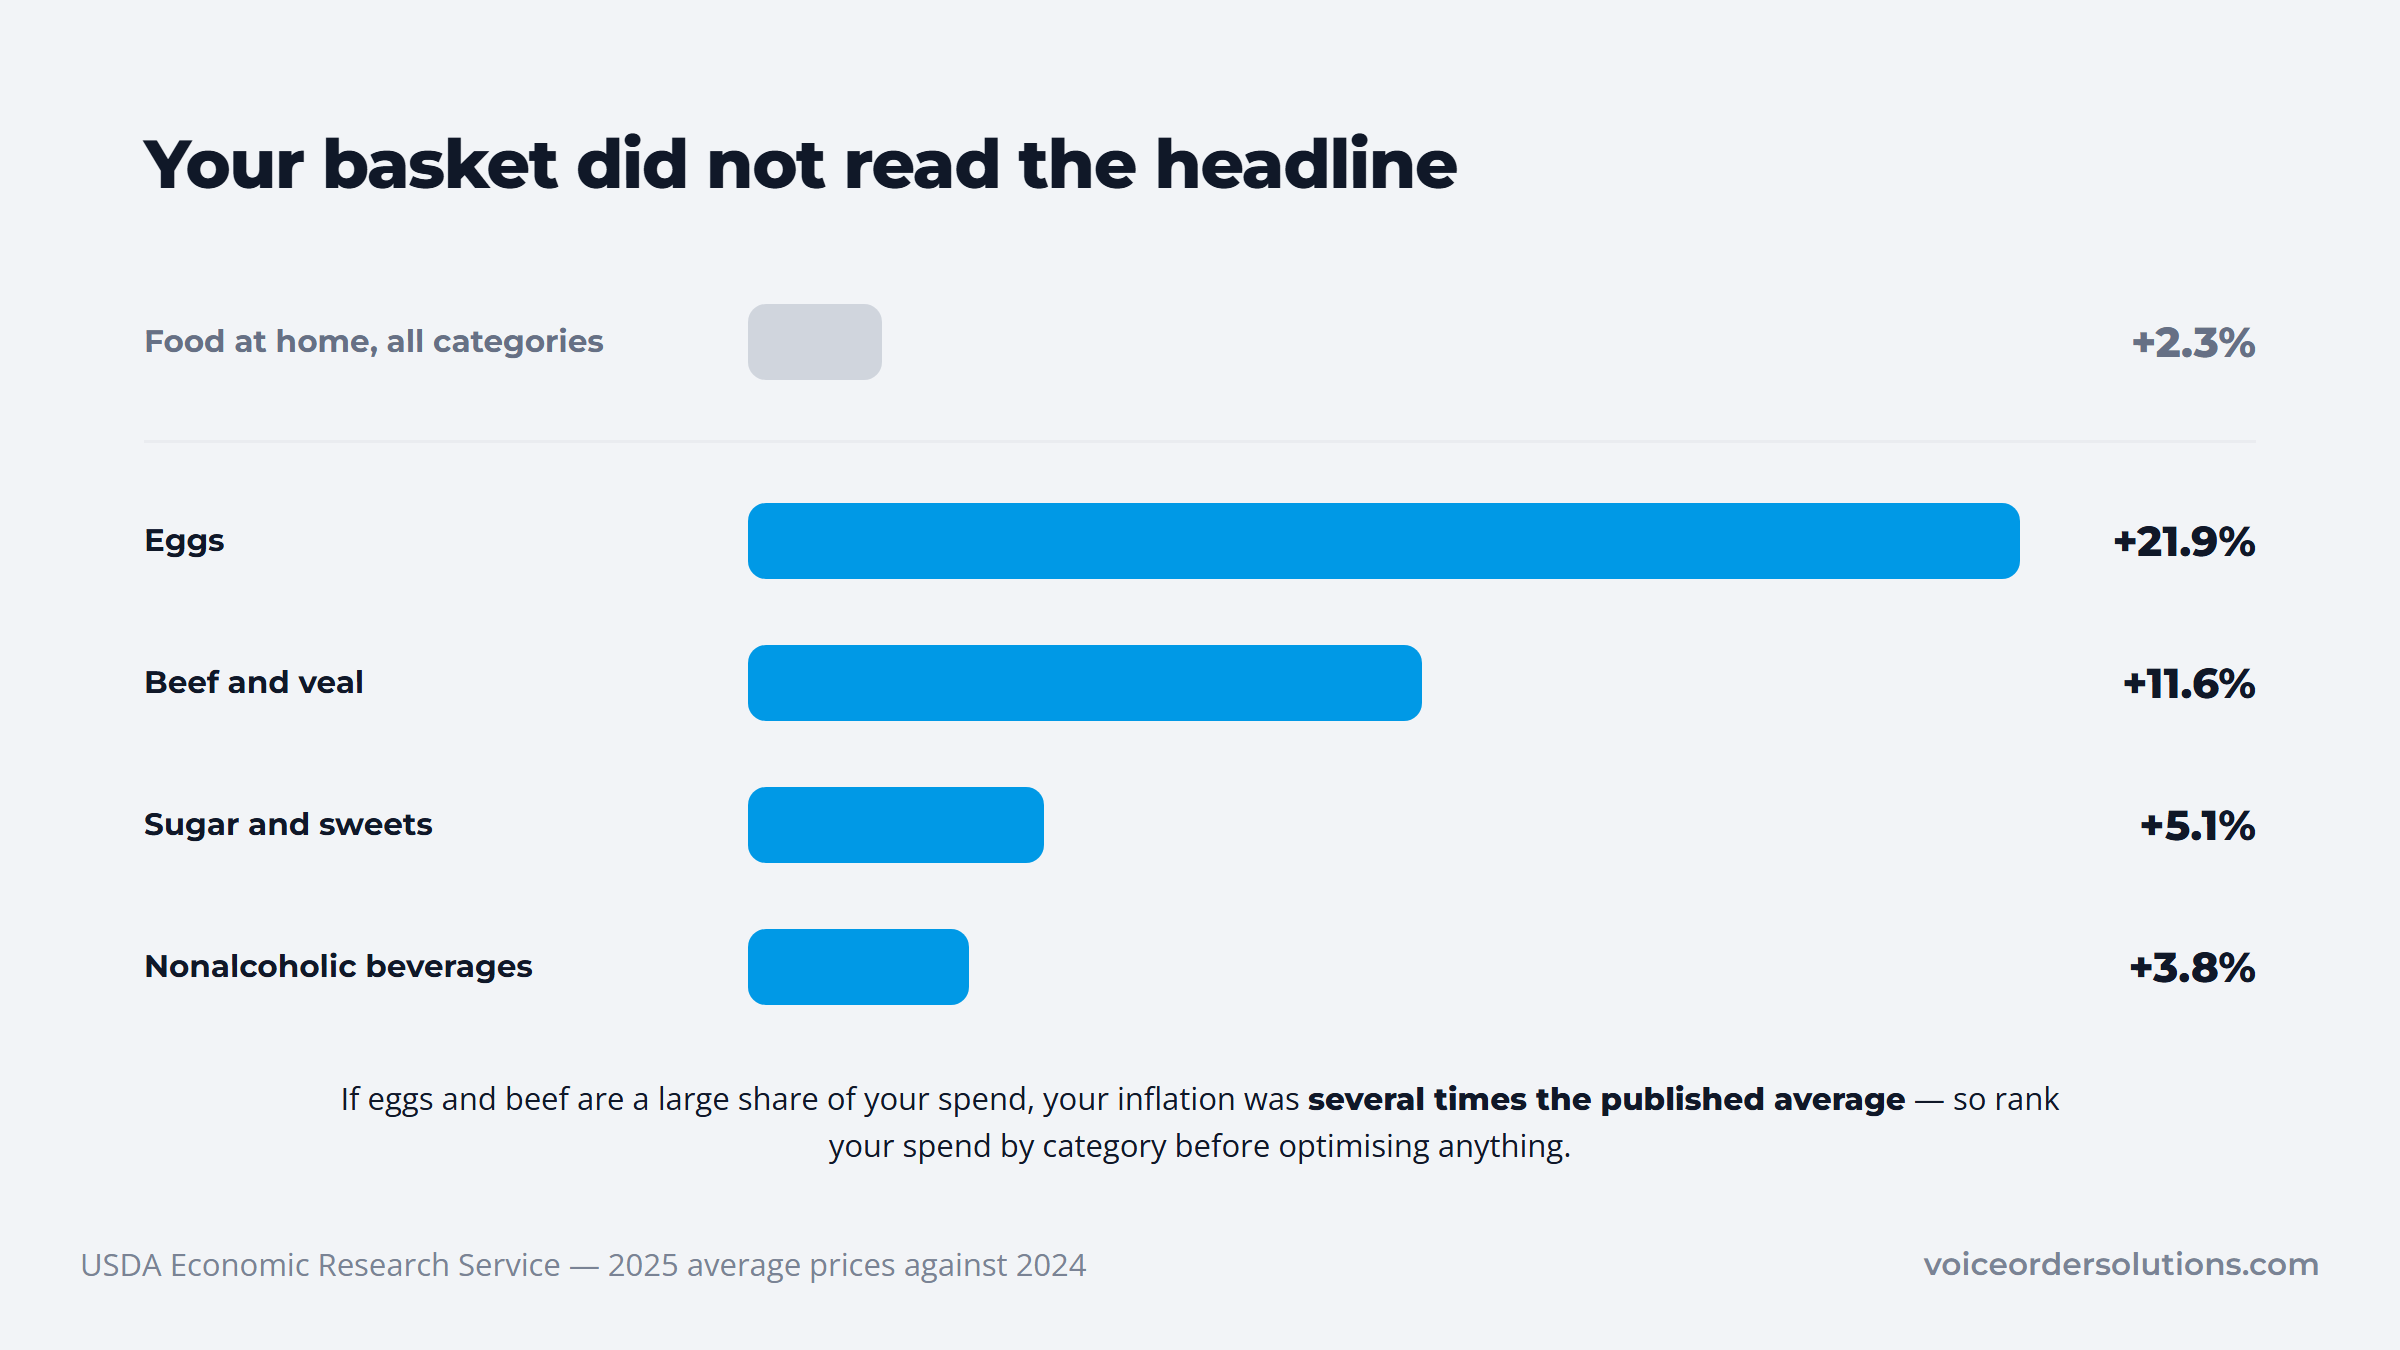
A network decision made on headline inflation therefore misprices your actual basket. If eggs and beef are a large share of your spend, your inflation was several times the published average, and the sourcing arrangement worth optimizing is the one covering those two categories.
Start any optimization by ranking your spend by category. The categories at the top are where a different supplier or a different delivery pattern changes your P&L.
Supply chain planning and network optimization appear interchangeably in vendor material and mean different things.
Network design is strategic and infrequent. It asks whether the structure itself is right: how many distributors, which regions, whether a central commissary makes sense. You revisit it when you open sites, change menus substantially, or lose a supplier.
Network planning is tactical and continuous. It asks how much to order this week and when, given the structure you already have.
Confusing them wastes money in both directions. Operators run weekly planning tweaks hoping to fix a structural problem, or commission a design study to solve what is really an ordering discipline issue.
The two are told apart by what you are seeing, not by what the vendor calls it.
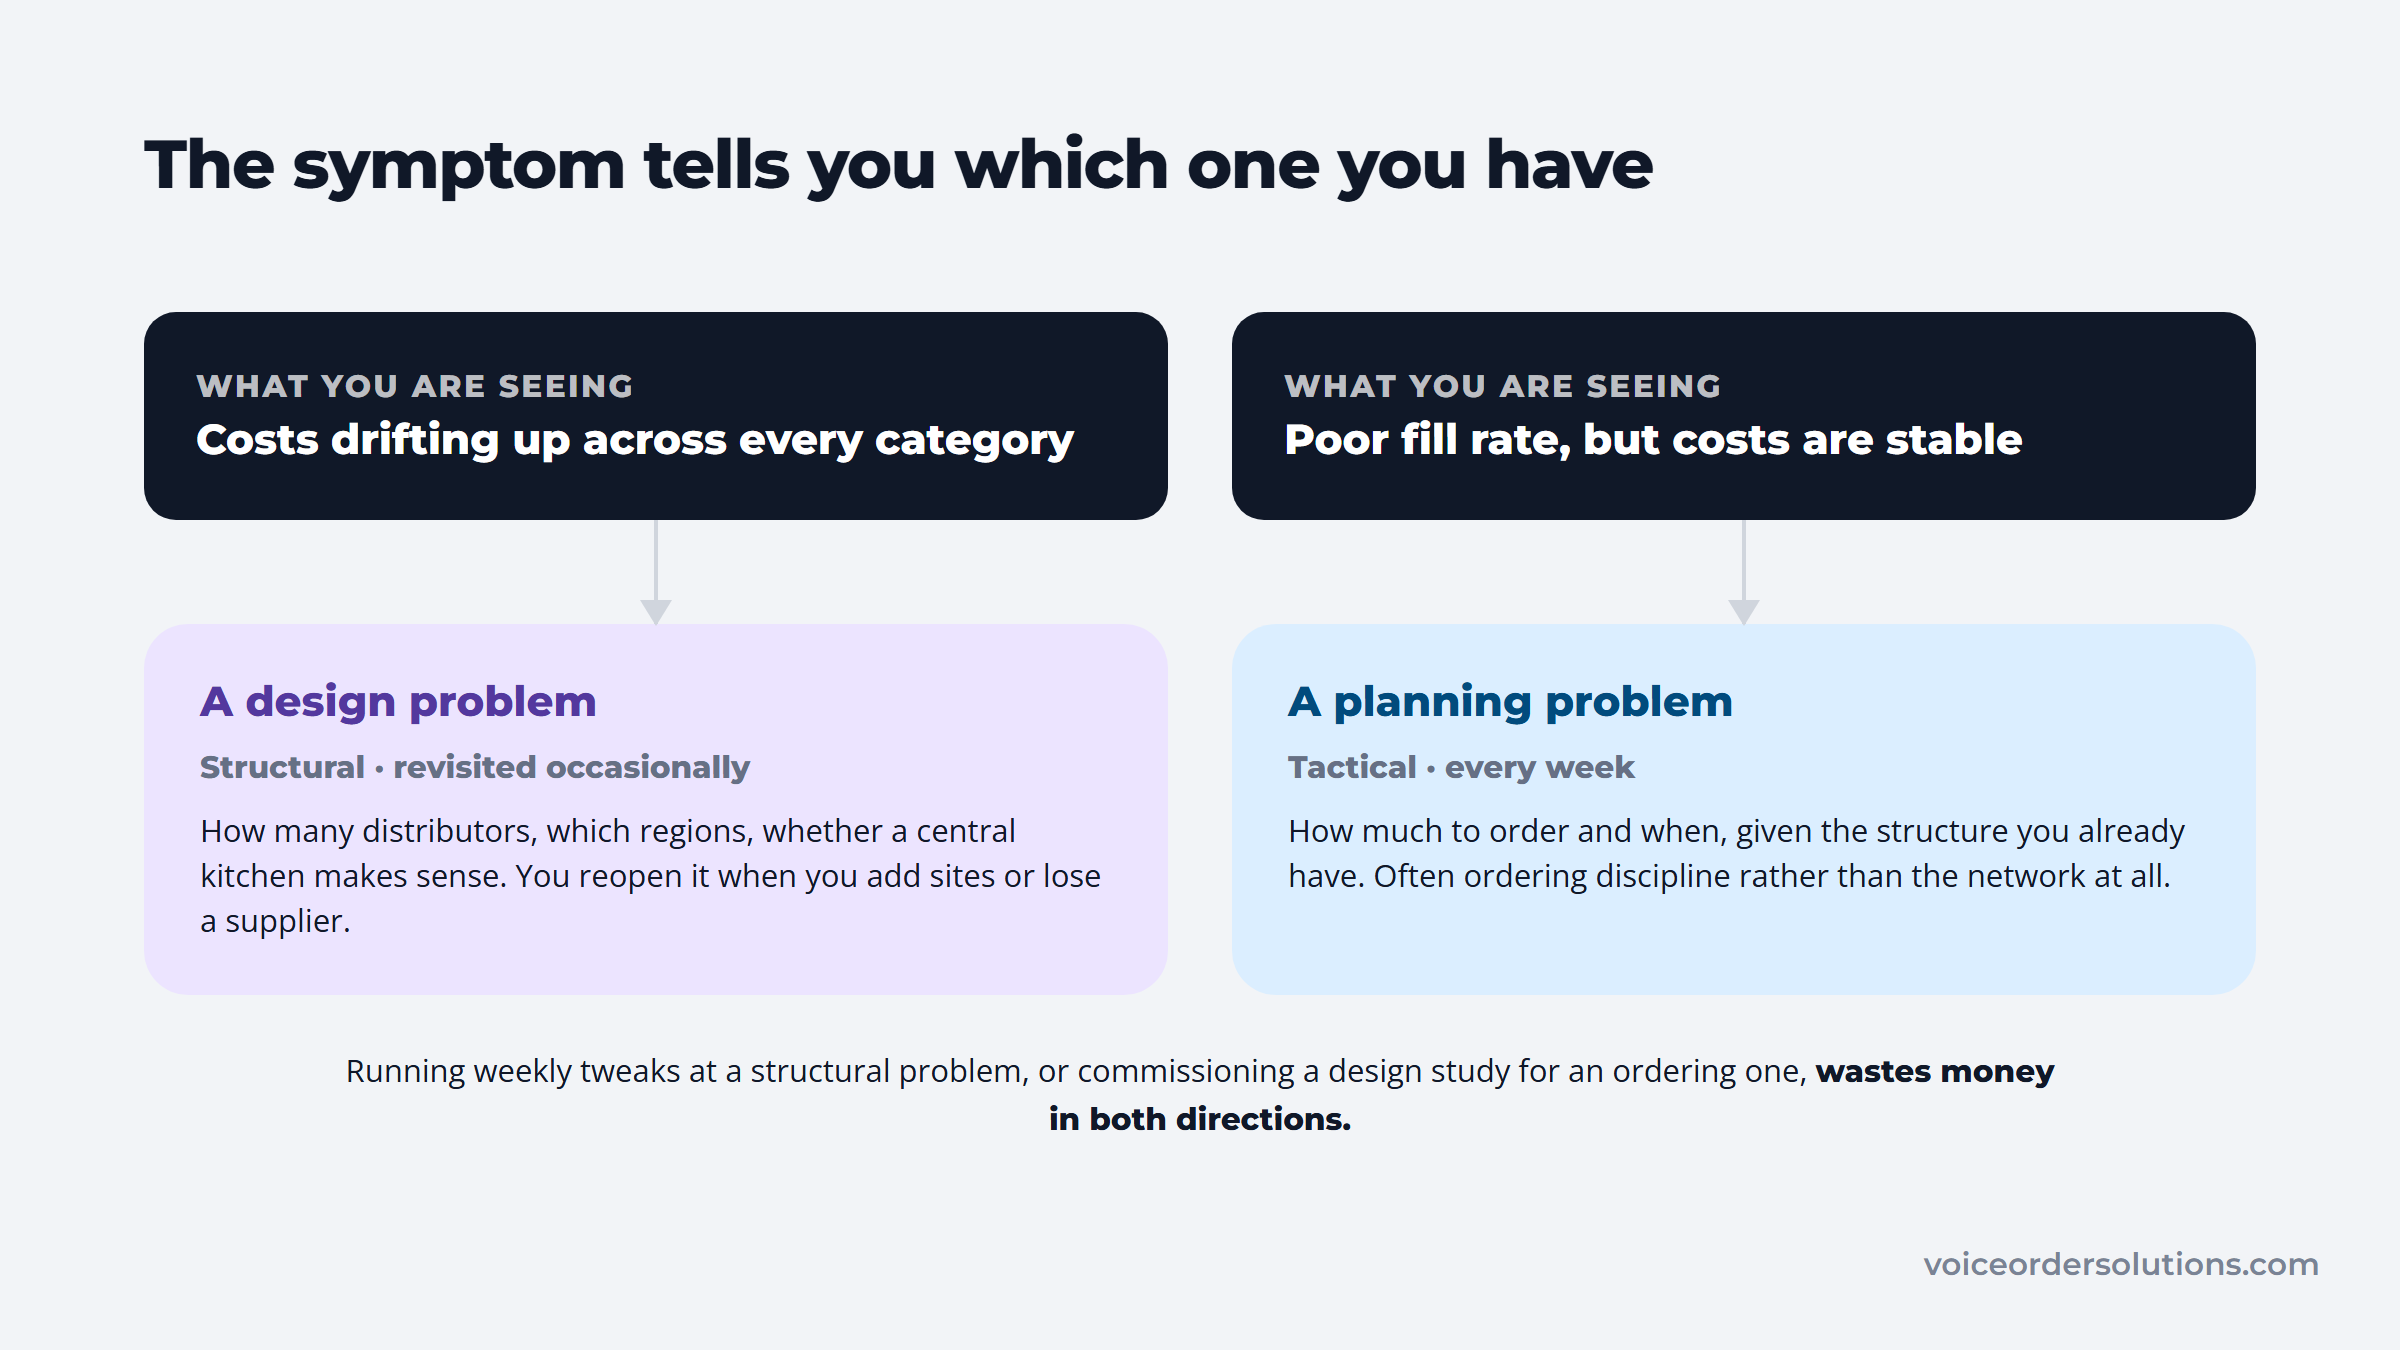
Diagnose which one you have before acting. If your costs are stable but your fill rate is poor, that is planning. If your costs drift upward across every category, that is design.
Most published network optimization techniques supply chain literature describes assume a manufacturer. These are the ones that transfer to a restaurant group without a consultant.
The second and third do the most work in practice. Consolidation converts scattered spend into leverage, and reducing delivery frequency removes cost from three places at once: the fee, the labor to receive, and the invoice to process. Both belong in a wider procurement strategy, set category by category rather than one supplier at a time.
Test the delivery-frequency change on one site for a month before applying it everywhere. Suppliers running direct store delivery routes price a stop rather than a case, so cutting a day saves less with them than it does on a consolidated broadline route.
Consolidation lowers cost and raises risk, and the tension is real rather than theoretical.
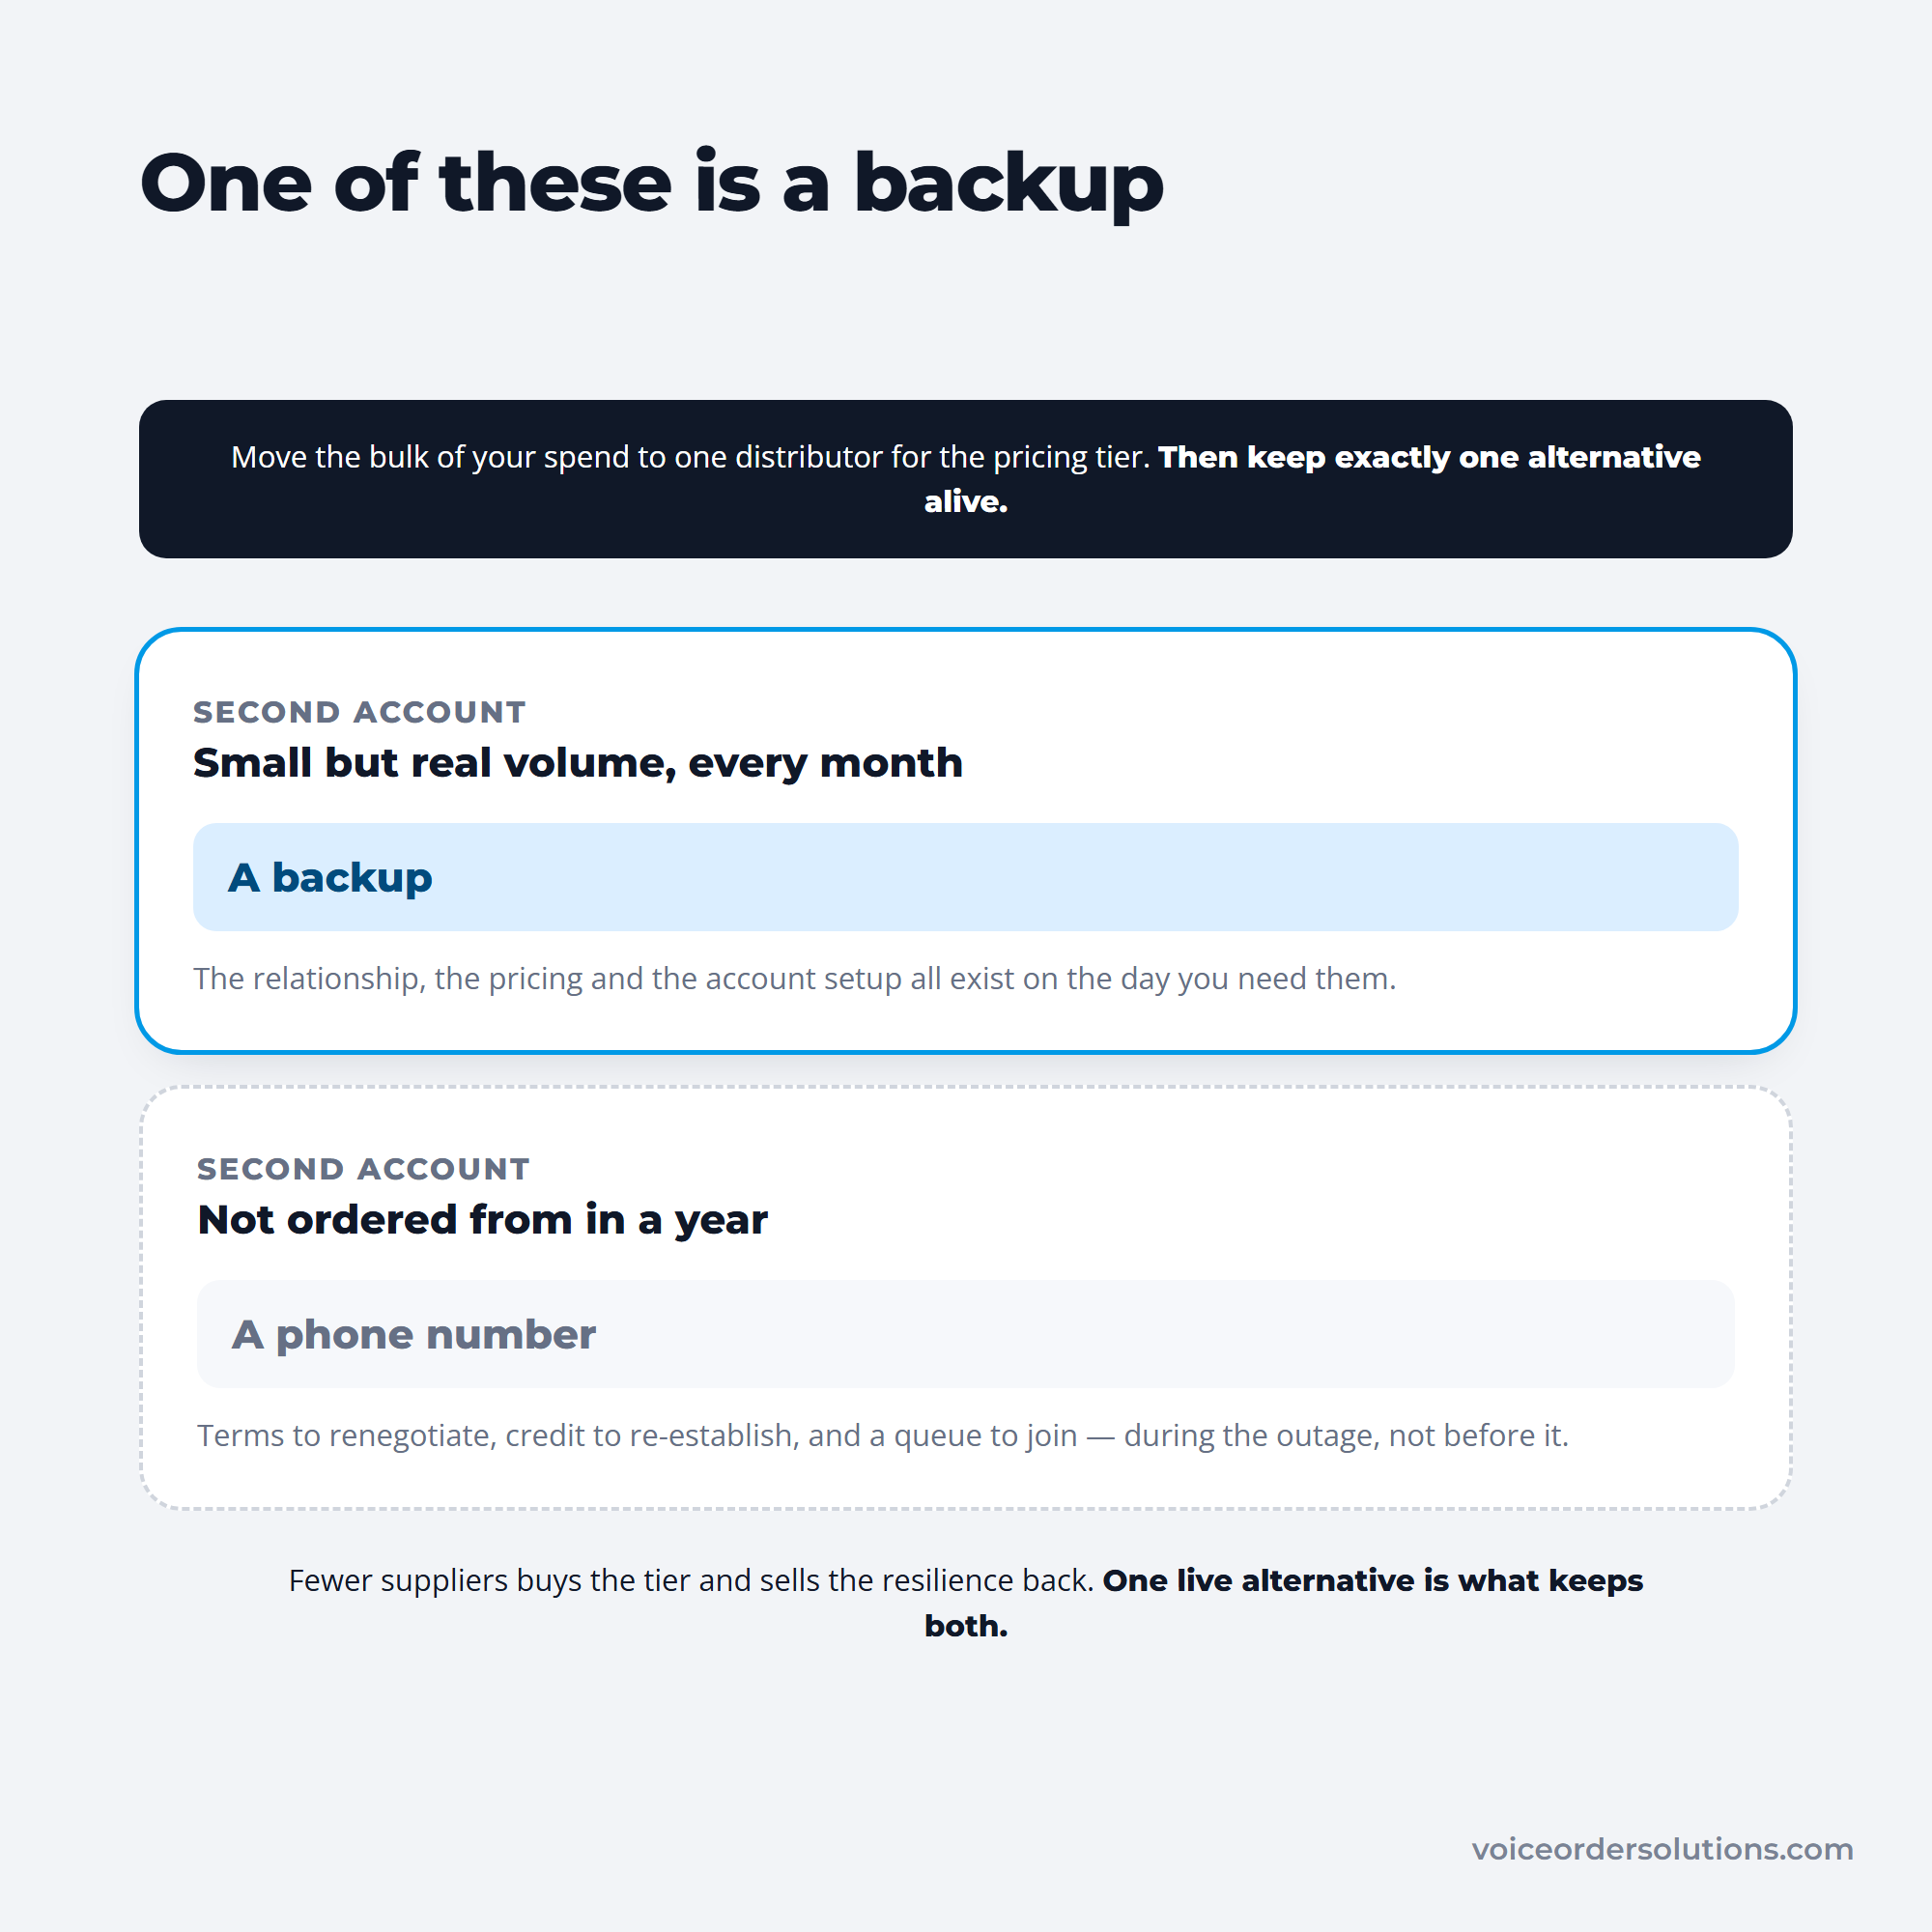
Fewer suppliers means better pricing tiers, fewer invoices, fewer deliveries to receive, and less price comparison work. It also means a single distributor outage empties more of your walk-in at once.
The workable compromise is consolidating volume while keeping a live alternative. Move the bulk of your spend to one broadline distributor for the pricing tier, and keep a second account active with real, if small, monthly volume so the relationship exists when you need it. Which account carries the bulk depends on the distribution model each one runs, because a broadline route and a direct-store-delivery run price volume very differently.
An account you have not ordered from in a year is not a backup. It is a phone number.
The test is whether anything has moved through the account in the last month.
Distributors on the other side of that decision face the same trade-off in their warehouse and distribution network. Restaurants that source produce or protein locally should treat those suppliers as deliberate exceptions rather than inefficiencies. Consolidating them into a broadline order usually costs quality, which is a different kind of expense.
Network optimization models assume orders arrive accurately and on time. In practice that assumption is where restaurant supply chains lose the gains a better network produces. Distributors make the same assumption in their distribution resource planning software, which can only plan the next day's picks, trucks and buying around the orders already in.
An optimized network with a 5pm cutoff still fails if the order is phoned in at 5:40 from a noisy kitchen and one line is transcribed wrong. The delivery misses its window, the site does an emergency top-up at retail prices, and the arrangement you carefully modeled produces a worse result than the one you replaced.
VoiceOrder Solutions addresses that specific layer, and it is the supplier who deploys it. Their customers order by voice through an app carrying that account's negotiated catalog, and every order lands structured and timestamped under its own reference number. Nothing waits in a voicemail queue to be typed up, so the cutoff holds.
Two properties matter for network performance. Orders land inside the cutoff rather than after it, because there is no queue of voicemails waiting to be typed up. And the timestamp gives you evidence for the fill-rate conversation with your distributor, which is otherwise a matter of competing recollections.
It handles the ordering step rather than the network itself, and it runs alongside whatever inventory or accounting system either side already uses.
Dedicated network optimization software exists and does real work at scale. It is also priced and designed for operators far larger than most restaurant groups.
These tools run mixed-integer programming across facility locations, transport lanes, and demand scenarios. They are bought by manufacturers, national chains, and distributors, and implementation is a project measured in months with a specialist involved.
Below roughly twenty locations the returns rarely justify it. The same decisions can be evaluated in a spreadsheet, because the option space is small and the data you need is your own invoices.
What is worth buying earlier is visibility. Knowing your delivered cost per category per site, which most operators cannot produce today, is the input every optimization needs. That usually comes from inventory and purchasing tooling rather than an optimization platform.
Distributors themselves sit further up the same curve, and their distribution ERP decisions shape the delivery options you get offered.
Network decisions are usually argued on price and settled by lead time, because lead time determines how much stock you must hold to avoid running out.
A supplier one day away and a supplier four days away can quote the same case price and cost very different amounts. The longer lead time forces a larger safety buffer, and in food that buffer either ties up cash or becomes waste.
Variability matters more than the average. A supplier who reliably takes three days is easier to plan around than one who averages two days but occasionally takes five, because you have to buffer against the worst case rather than the typical one.
Laid out delivery by delivery, the faster supplier is the one that costs you stock.
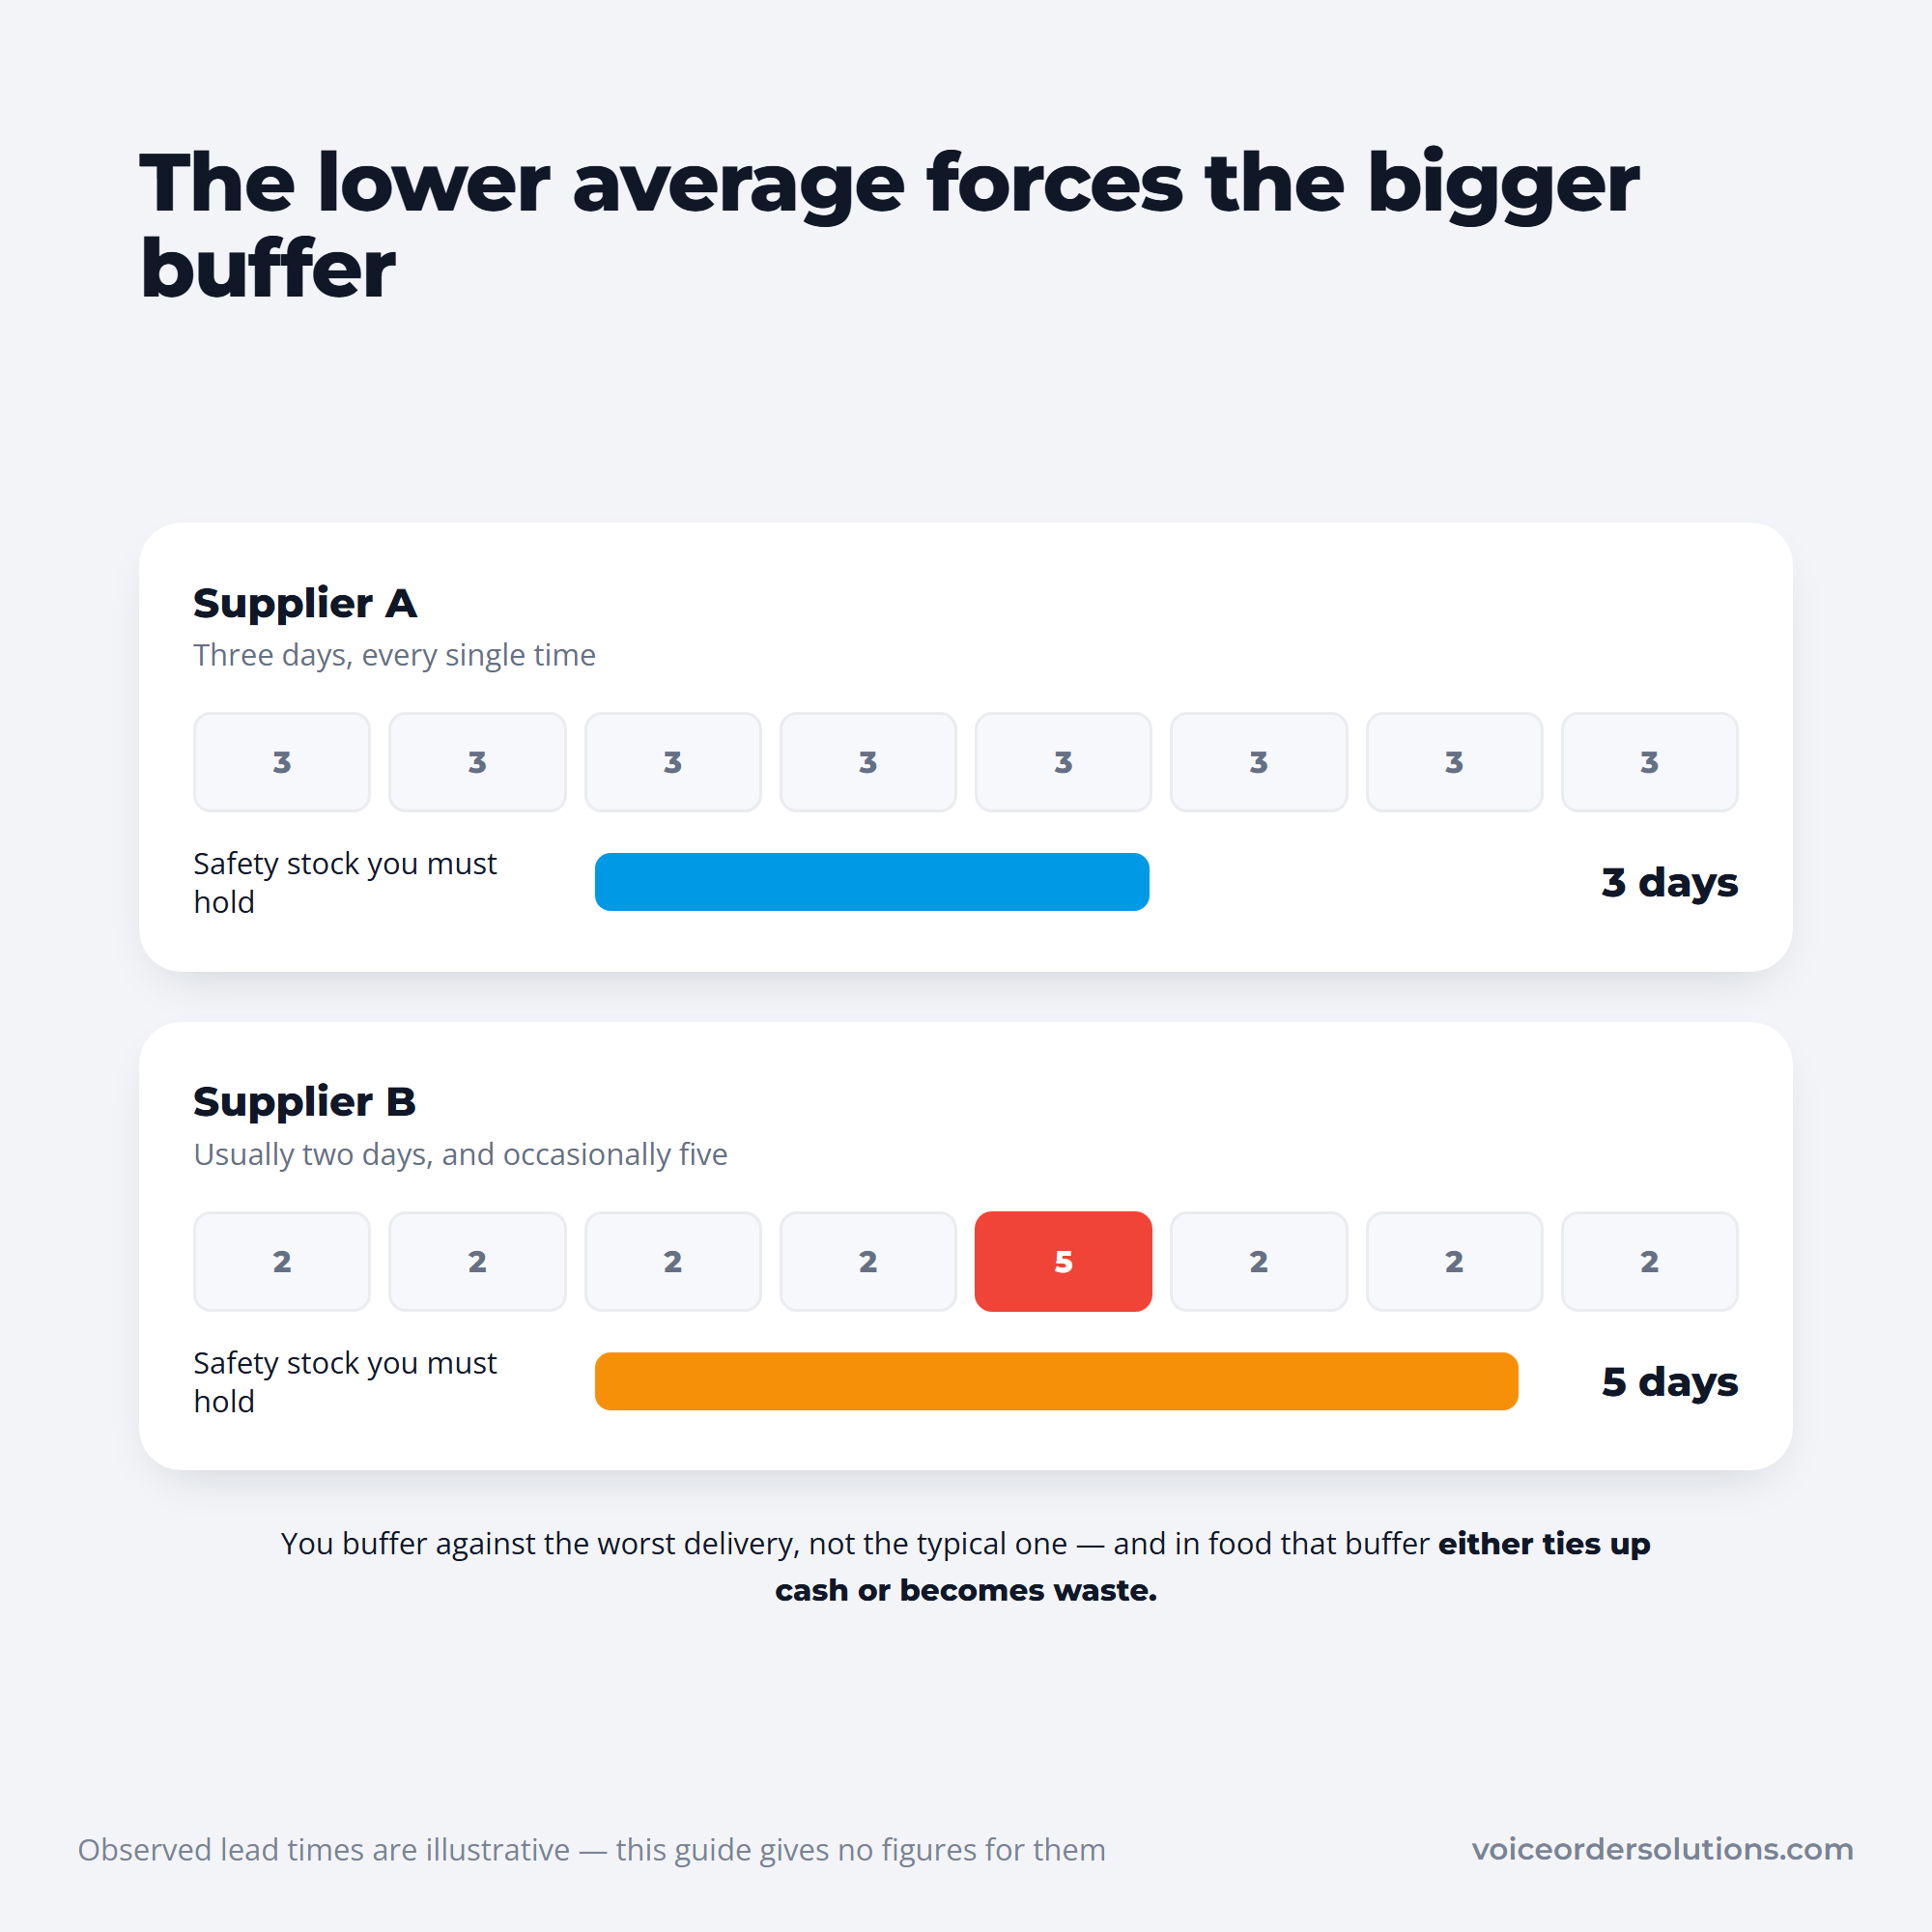
Record actual delivery lead times per supplier for a month rather than using the quoted figure. Most operators find at least one supplier whose real performance differs noticeably from what the account manager states.
Log four things per delivery while you do it:
Those four columns take seconds to fill in and produce the only lead-time data you can trust. Quoted lead times describe the supplier's intention; this describes their behavior. Where a distributor already runs order tracking software, the first two columns exist on their side and can simply be requested rather than rebuilt by hand.
Then set safety stock against measured variability instead of a flat rule. Applying the same buffer to a dependable supplier and an erratic one overstocks the first and still leaves you short on the second. A safety stock calculator sets that buffer from your demand swing and each supplier's real late-delivery record.
Network changes are easy to declare successful and hard to prove, because several variables move at once.
Fix the measurement before making the change. Record delivered cost per category, fill rate by supplier, number of deliveries per week, emergency purchases per month, and hours spent receiving, for at least four weeks beforehand.
Then change one thing. Consolidating suppliers and cutting delivery days in the same month makes the result uninterpretable.
Watch the transport side too. The American Transportation Research Institute found congestion cost trucking $108.8 billion in 2022, with 86.7% of that cost concentrated on 17.2% of highway miles. Your distributor's route into your city is a real cost driver, and it is why delivery windows tighten in some markets and not others.
Give any change a full quarter before judging it. Seasonal demand will otherwise explain your result better than your network change does.
Pull twelve months of invoices and rank spend by category. That single exercise usually reveals that three or four categories account for most of your food cost and most of your price volatility. Set that against a full restaurant operating costs breakdown and you can see which line is genuinely worth the negotiating effort.
Then count your suppliers per category. Operators who have never done this typically find two or three suppliers covering the same category at different prices, which is leverage sitting unused. Compare those prices per unit delivered rather than per case, which a landed cost calculator does for up to three quotes with freight included.
Pick the one change with the clearest arithmetic, usually either consolidating a category or removing a delivery day, and run it at a single site for a month with the baseline already recorded.
Where the ordering step is the part that keeps undoing the plan, raise it with the distributor, because that is who deploys the fix. Independent food distributors use VoiceOrder Solutions to get their accounts ordering inside the cutoff, and it reports into the order management system they already run. Contact the team to see how it fits an existing order guide.
It is working out the cheapest arrangement of suppliers, storage, and deliveries that still meets your service requirements. Large companies solve it mathematically across factories and warehouses. A restaurant group solves the same question at a smaller scale: which distributors, serving which sites, delivering how often, with what order cutoffs. The principle is identical even though the tooling is not.
The formal software is built for manufacturers and large chains. The underlying decisions apply to any operator with more than one supplier: how many distributors to use, which sites buy from whom, and how many deliveries a week you actually need. Most independents get more from reviewing those three choices annually than from any optimization platform, and the review costs nothing but the time to sort your invoices.
Design is structural and occasional: how many distributors, which regions, whether to run a central kitchen. Planning is tactical and ongoing: how much to order this week given that structure. They fail differently. Rising costs across every category usually points to a design problem, while poor fill rates with stable costs usually points to planning or ordering discipline.
The three reliable levers for a restaurant group are consolidating spend to reach better pricing tiers, cutting unnecessary delivery days, and standardizing the item list across sites so group volume counts as one negotiation. Compare suppliers on total delivered cost including fees and minimum-order penalties rather than unit price, since a lower unit price with a higher delivery fee frequently costs more.
At minimum, twelve months of invoices broken down by category and supplier, delivery frequency and fees per supplier, and fill-rate history if you have it.
Most operators can produce the first and not the others, which is why the honest first step is usually improving purchasing records rather than running an optimization. A model built on incomplete data produces a confident recommendation you cannot trust, which is worse than no recommendation because it invites action.