.webp)
Key takeaways:
A restaurant can be busy, well-reviewed, and still lose money, because the costs behind the food move faster than the menu prices in front of it. Knowing exactly where your money goes, category by category, is the difference between fixing a margin problem and guessing at it.
This is a breakdown of restaurant operating costs in 2026: what the major categories are, what percentage of sales each should run, where the real numbers sit according to industry data, and how to track and cut them without hurting the guest experience. Every benchmark here is tied to its source, because averages float around the internet with no origin and half of them are years out of date.
Operating costs are the recurring expenses of running the restaurant day to day, separate from the one-time costs of opening it. They fall into a handful of categories, and knowing which is which is the first step to controlling them.
The major operating cost categories are food and beverage (your cost of goods sold), labor (wages, salaries, benefits, and taxes), occupancy (rent and utilities), operating overhead (insurance, repairs, supplies, technology), and marketing. Some are fixed, like rent, and some are variable, like food, which rises and falls with how busy you are.
It helps to separate operating costs from startup costs. Equipment at $100,000 to $300,000, a liquor license anywhere from $50,000 to $300,000 depending on your state, and a POS system at $700 to $2,500 are one-time or occasional outlays, not the recurring costs this breakdown tracks. Keep them in a separate line so they do not distort your monthly percentages.
Every category below is expressed as a percentage of sales, because that is the only way to compare costs across different revenue levels and spot when one line is creeping out of range.
The average restaurant operating costs breakdown looks like this in a typical full-service restaurant, with each range anchored to current data rather than a recycled blog figure. Treat these as targets, not laws; a steakhouse and a pizza counter sit at opposite ends of the food-cost range for good reasons.
| Cost category | Share of sales | Anchor |
|---|---|---|
| Food and beverage (COGS) | 28% to 35% | NRA 2024 median ~32% |
| Labor | 30% to 37% | NRA 2024 full-service median 36.5% |
| Occupancy (rent and utilities) | 5% to 10% | 12% to 15% in high-rent urban markets |
| Operating overhead | 10% to 15% | Insurance, repairs, supplies, tech |
| Marketing | 3% to 6% | Varies with growth stage |
| Net profit | 3% to 8% | ~5% is a common average |
The single most important line is not in the table by itself: prime cost, food plus labor combined, should land between 55% and 65% of sales. Above 65% and the math stops working, no matter how strong your revenue looks.
One number in that table trips people up. Some guides claim restaurants keep 15% to 20% of sales as profit, which conflicts with the 3% to 8% net margin most operators actually see. The gap is what those rosier figures leave out: taxes, loan payments, owner pay, and reinvestment.
When you add food at 32%, labor at 36.5%, occupancy, and overhead, you are already near 90% of sales before those items, which is exactly why true net margin is thin.
To make it concrete, take a restaurant doing $100,000 a month in sales. At those medians, food runs about $32,000 and labor about $36,500, so prime cost alone is roughly $68,500. Add $8,000 in occupancy and $12,000 in overhead and you are at $88,500 before marketing, taxes, or debt payments.
That leaves very little room, which is the real lesson of the breakdown: a two-point swing in food or labor, small as it sounds, is often the whole difference between a profitable month and a loss.
Food and beverage is the cost you can move the fastest, up or down, which makes it the first place to look. The National Restaurant Association's 2025 Restaurant Operations Data Abstract, drawn from 900-plus operators, puts full-service food and non-alcohol beverage cost at a median of 32.0% of sales in 2024, with limited-service at 32.4%.
Concept decides where in the band you belong, and the edges are further apart than most operators assume.
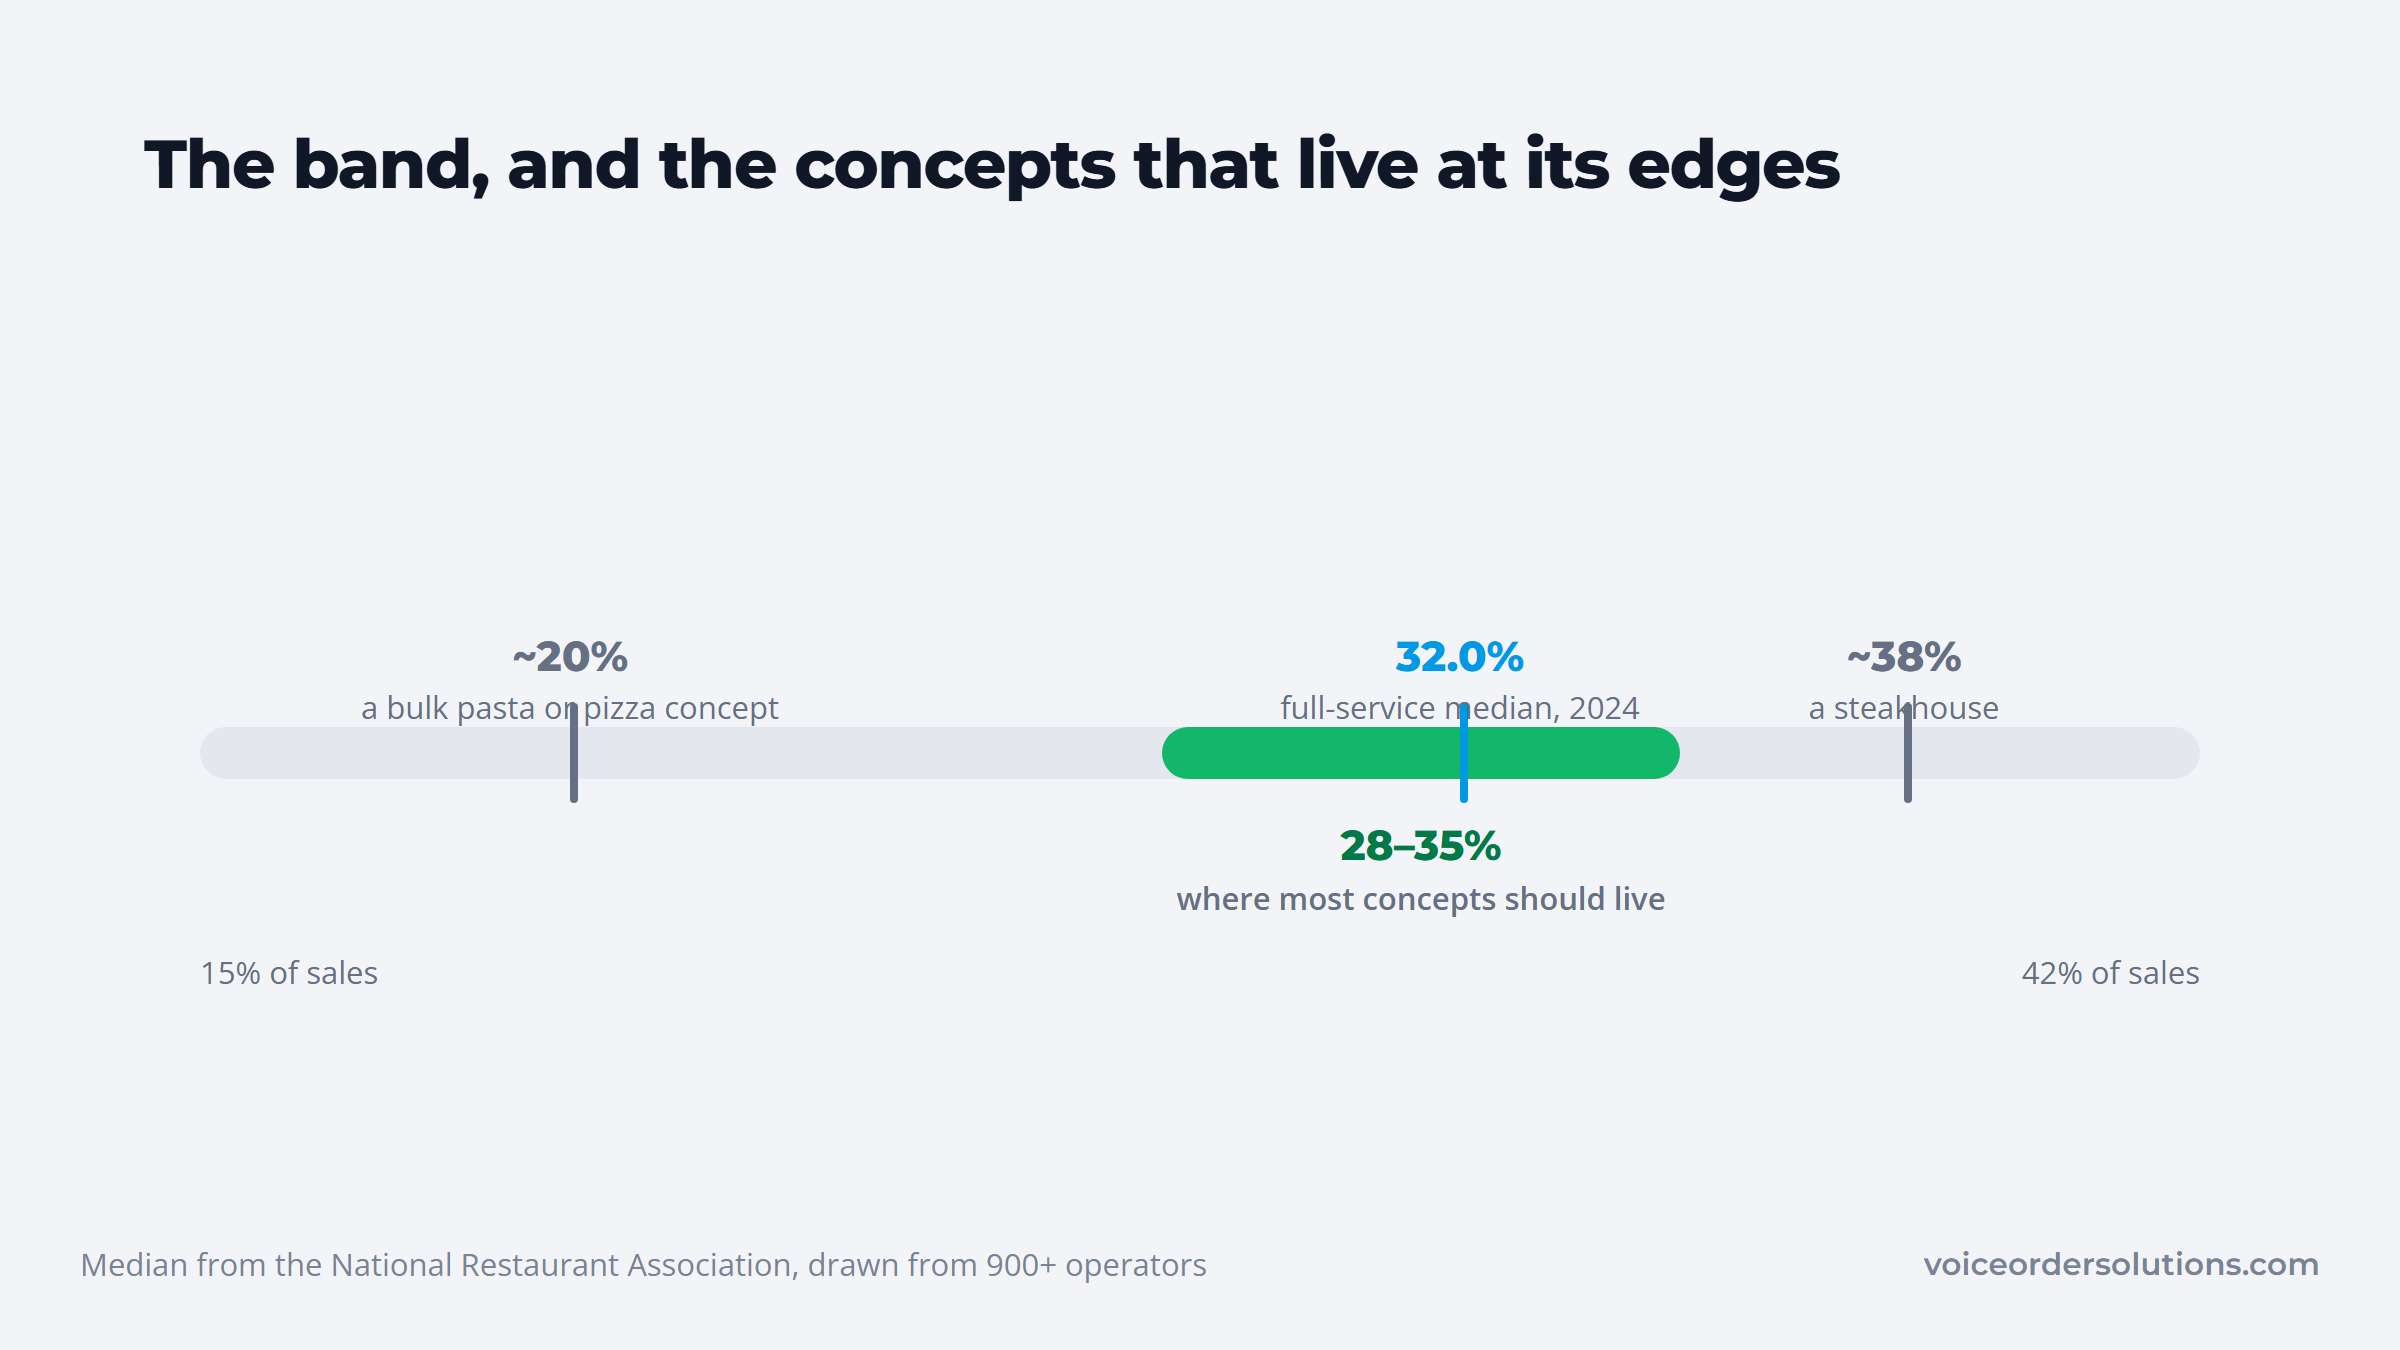
That 28% to 35% band is where most concepts should live. A bulk-pasta or pizza concept can run near 20%, a steakhouse near 38%, but if your food cost sits far outside 28% to 35% without a concept-specific reason, something is off in pricing or portioning.
Controlling food cost means measuring it correctly first, then working four levers.
Food cost is a discipline, not a one-time fix. A chunk of it is simply ordering accuracy, since over-ordering that spoils and wrong quantities from a rushed phone order both land in this number, which is why tools like VoiceOrder Solutions that keep supplier orders accurate quietly protect food cost too. The counting side of the same problem is what food inventory control software handles.
The operators who keep it in range are the ones who measure it every week and adjust portions and prices before a small drift becomes a real problem.
For years the rule of thumb was to keep labor under 30% of sales. That rule is out of date. The NRA's 2025 data shows full-service labor cost at a median of 36.5% of sales in 2024, well above the roughly 33% of a decade ago, with limited-service at 31.7%. Wages have risen and so has the benchmark.
That makes labor the line most likely to blow up your prime cost, and the one where small inefficiencies add up fastest. Every hour of paid time spent on repetitive, low-value work is margin you are handing away.
Some of that time is easy to miss. The half hour a week a manager spends phoning in supplier orders, then re-keying or chasing them, is paid labor spent on a task that tools like VoiceOrder Solutions are built to remove by letting staff speak the order once instead. It is a small line on its own, and small lines are exactly what a tight labor budget is made of. Stacked across a year, that half hour is one of the clearer arguments for voice ordering in restaurant operations.
Keeping labor in range is a mix of measuring it fully and scheduling it tightly.
Labor will likely stay your highest or second-highest cost, so managing it is less about slashing hours and more about making sure every paid hour is doing something worth paying for.
After food and labor, the next tier of costs is smaller but less flexible, which makes it easy to ignore until it hurts.
Occupancy, rent plus utilities, should run 5% to 10% of sales, though high-rent urban markets push that to 12% to 15%. Rent is fixed once you sign, so the time to control it is at the lease, not after.
Utilities you can trim with efficient equipment and simple habits, but do not expect miracles. A full-service kitchen commonly runs several hundred dollars a month in electricity alone, and it climbs with older equipment and heavy hood use, so the savings come from maintenance and scheduling, not one big move.
Operating overhead, 10% to 15% of sales, covers insurance, repairs and maintenance, cleaning and paper supplies, and technology subscriptions. Individually these look minor; together they are a meaningful chunk of the bill, and they creep, so review them at least quarterly and cancel what you no longer use.
Marketing typically runs 3% to 6% of sales, higher when you are new or pushing growth. Spend it where you can measure the return, and treat it as an investment with a tracked payback, not a fixed cost you set and forget. Getting this middle tier right will not save your restaurant on its own, but letting it drift can quietly cost you a point or two of margin you would rather keep.
The categories above are the ones everyone tracks. The costs that sink restaurants are usually the ones nobody is watching, because they hide inside other numbers.
| Hidden cost | Typical rate | Where it hides |
|---|---|---|
| Payment processing | 2.2% to 4.5% per transaction | Every card sale |
| Third-party delivery | 15% to 30% per order | Delivery-app tickets |
| Inventory shrinkage | Varies | Gap between what you used and sold |
| Order and prep errors | Varies | Over-ordering, waste, wrong deliveries |
Payment processing and delivery commissions are the obvious two. At 2.2% to 4.5% per card transaction and 15% to 30% per delivery order, they quietly take a slice of revenue you never see as a bill, which is why so many operators underestimate them.
Put real numbers on them and they stop looking like rounding errors.
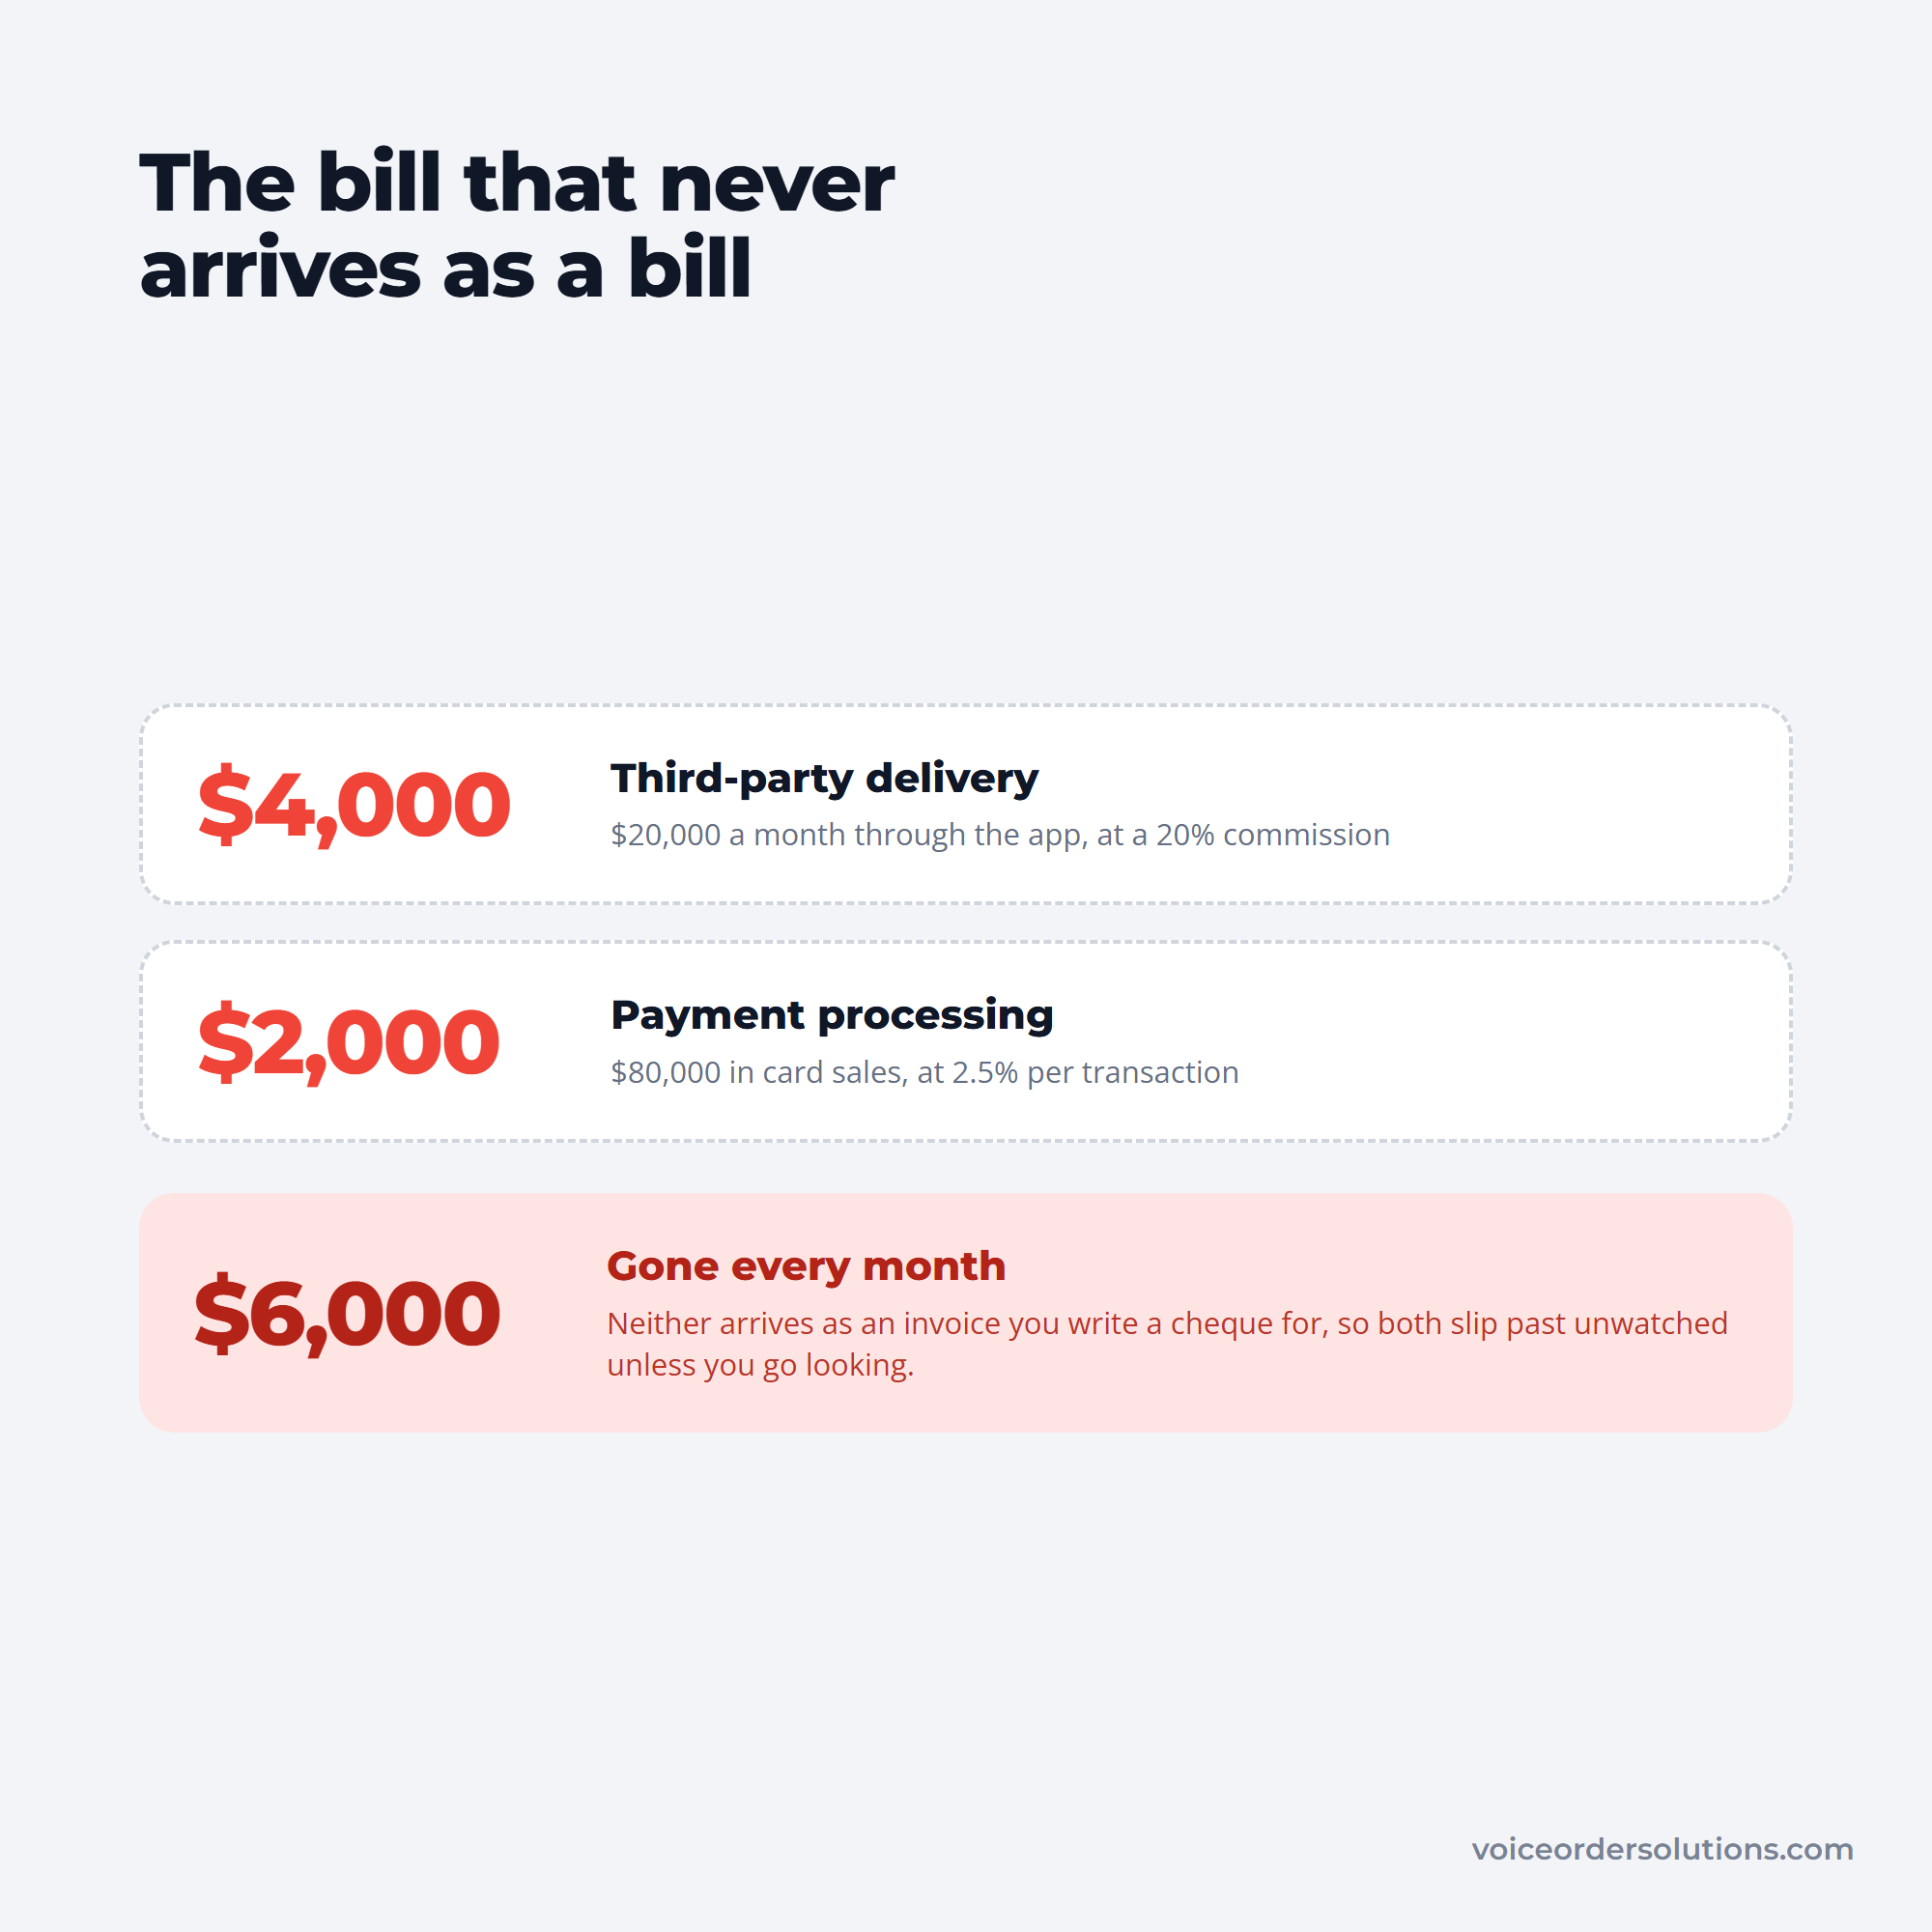
The dollars add up fast. A restaurant running $20,000 a month through a delivery app at a 20% commission hands over $4,000, and $80,000 in card sales at 2.5% is another $2,000. Neither arrives as an invoice you write a check for, so they slip past unwatched unless you go looking for them.
Staff turnover belongs here too. The restaurant industry has the highest quit rate of any sector, and every departure means rehiring and retraining, which industry surveys put in the thousands of dollars per hire. High turnover quietly taxes both your labor line and your service quality at the same time.
Shrinkage is the sneakiest. One operator on Reddit described running a beginning and ending count and finding 25 portioned tenderloins gone with only 22 sold and zero comps, a gap that only surfaced because they counted.
If you are not doing regular inventory counts, shrinkage from theft, waste, and over-portioning is invisible, and invisible costs never get fixed. A structured restaurant inventory list counted on a schedule is what turns that gap into a number you can act on.
Order and prep errors belong on this list too. A wrong or over-ordered delivery becomes food you paid for and never sold, and a supplier order re-keyed by hand is a common source of exactly those errors. Tightening how orders get placed, so quantities are right and nothing gets double-ordered, closes a leak that hides inside your food-cost number rather than showing up on its own.
A restaurant operating costs breakdown is only useful if you act on it, and acting on it means a tracking routine, not an annual panic when the accountant calls. The operators who stay profitable watch the numbers on a schedule.
A simple mental model many operators use is the 30/30/30/10 rule: roughly 30% of sales to food, 30% to labor, 30% to overhead and occupancy, and 10% left as profit. It is a target to steer by, not a guarantee, and the real numbers above show labor often runs hotter than 30%, but it is a fast gut check on whether a restaurant is even in the right shape.
A workable routine splits the checks by how fast each number moves.
The reason to track this closely is that revenue hides problems. One operator on Reddit laid out a restaurant doing $60,000 a month in sales that was barely profitable, because a 50% food cost left only about $8,000 before the owner's own pay. Strong sales masked a single cost line that was double where it should be, and only a real breakdown would have caught it.
Once you can see the numbers, cutting is targeted rather than painful. Tighten portions and pricing to pull food cost toward 32%, schedule labor to forecasts, renegotiate or drop overhead you do not use, and close the quiet leaks like order errors and shrinkage.
If manual, error-prone ordering is one of those leaks for you, contact VoiceOrder Solutions to see how cleaner order placement trims both wasted food and wasted labor. Small, tracked cuts across several lines add up to the margin that keeps the doors open.
A typical restaurant operating costs breakdown runs food and beverage at 28% to 35% of sales, labor at 30% to 37%, occupancy at 5% to 10%, operating overhead at 10% to 15%, and marketing at 3% to 6%, leaving a net profit of about 3% to 8%. The key combined number is prime cost (food plus labor), which should stay between 55% and 65% of sales.
The old target was under 30% of sales, but that is outdated. The National Restaurant Association's 2025 data shows full-service labor at a median of 36.5% of sales in 2024 and limited-service at 31.7%. A healthy range today is roughly 30% to 36%, depending on your service model, as long as your total prime cost stays under 65%.
Most restaurants should keep food and beverage cost between 28% and 35% of sales, with the National Restaurant Association's 2024 median at about 32%. Concept matters: a pizza or pasta concept can run near 20%, a steakhouse near 38%. Calculate it as (beginning inventory + purchases − ending inventory) ÷ food sales over a full period.
Prime cost is your food and beverage cost plus your total labor cost, expressed as a percentage of sales. It matters because it is the largest and most controllable share of your expenses, and it is the fastest signal of trouble. A prime cost between 55% and 65% is healthy; above 65% and profit gets very hard to reach.
Most restaurants net between 3% and 8% of sales, with around 5% being a common average. Figures of 15% to 20% usually describe money left before taxes, debt payments, owner pay, and reinvestment, not true net profit. Thin margins are exactly why tracking your cost breakdown closely matters so much.