.webp)
Key takeaways:
Most restaurants already have analytics and don't use them. The POS produces reports nobody opens, the inventory tool exports a variance file nobody reconciles, and the actual decisions get made from a gut feel about last Saturday.
Restaurant analytics software is meant to fix that by consolidating scattered numbers into something a manager will actually look at before a shift. Whether it works depends far more on data hygiene than on the dashboard.
This guide covers 12 platforms, from dedicated analytics layers to the reporting built into systems you may already pay for, with verified pricing where it exists.
Restaurant analytics software collects operational data from your point of sale, labor system, and stock counts, then presents it as trends, comparisons, and alerts rather than raw exports. The useful ones answer questions across sources, such as whether Tuesday's labor overrun tracked a genuine sales lift or just a bad schedule.
The category splits three ways in practice. Dedicated analytics platforms sit above your existing stack and consolidate it. Built-in analytics come free inside a POS or management suite you already run. Predictive tools use history to forecast demand instead of describing the past.
That distinction decides what you should buy. If your numbers already live in one platform, built-in reporting may be sufficient, and a dedicated tool earns its cost mainly when data is scattered across several systems that don't talk to each other.
The table compares all 12 by what they analyze and what they cost. Note how few publish pricing, which is characteristic of this category and worth factoring into your evaluation time.
| Tool | Best for | Analytics focus | Main limitation | Pricing (from) | Rating |
|---|---|---|---|---|---|
| Tenzo | Consolidating a scattered stack | Cross-source reporting | No published pricing | Quote-based | ★★★★★ |
| Avero | Full-service and hotel F&B | Server and menu performance | No published pricing | Quote-based | ★★★★☆ |
| Crunchtime | Enterprise chains | Labor and inventory analytics | Enterprise sales cycle | Quote-based | ★★★★☆ |
| Restaurant365 | Accounting-led operators | Financial and cost analytics | Requires the full platform | Quote-based | ★★★★☆ |
| Toast | Restaurants on Toast POS | Sales and labor reporting | Only covers Toast data | $0-69/month | ★★★★☆ |
| MarginEdge | Food cost visibility | Invoice and margin analytics | Not general analytics | $350/location/month | ★★★★☆ |
| Lineup.ai | Forecast-driven planning | Predictive sales forecasting | Forecasting only | $79/location/month | ★★★★☆ |
| Nory | AI-led multi-site groups | Forecast and P&L analytics | No published pricing | Quote-based | ★★★★☆ |
| Fourth | Enterprise workforce analytics | Labor and demand analytics | Built for scale | Quote-based | ★★★★☆ |
| Square for Restaurants | Small sites wanting free reporting | Sales and labor basics | Limited depth | Free / $49/month | ★★★★☆ |
| Apicbase | Multi-outlet recipe analytics | Menu and production data | Priced per outlet | Quote-based | ★★★★☆ |
| Lightspeed Restaurant | POS-tied inventory analytics | Sales and stock reporting | Inventory is an add-on | Custom quote | ★★★★☆ |
Work out whether your data is scattered or already centralized before shortlisting, because that single fact eliminates roughly half this list.
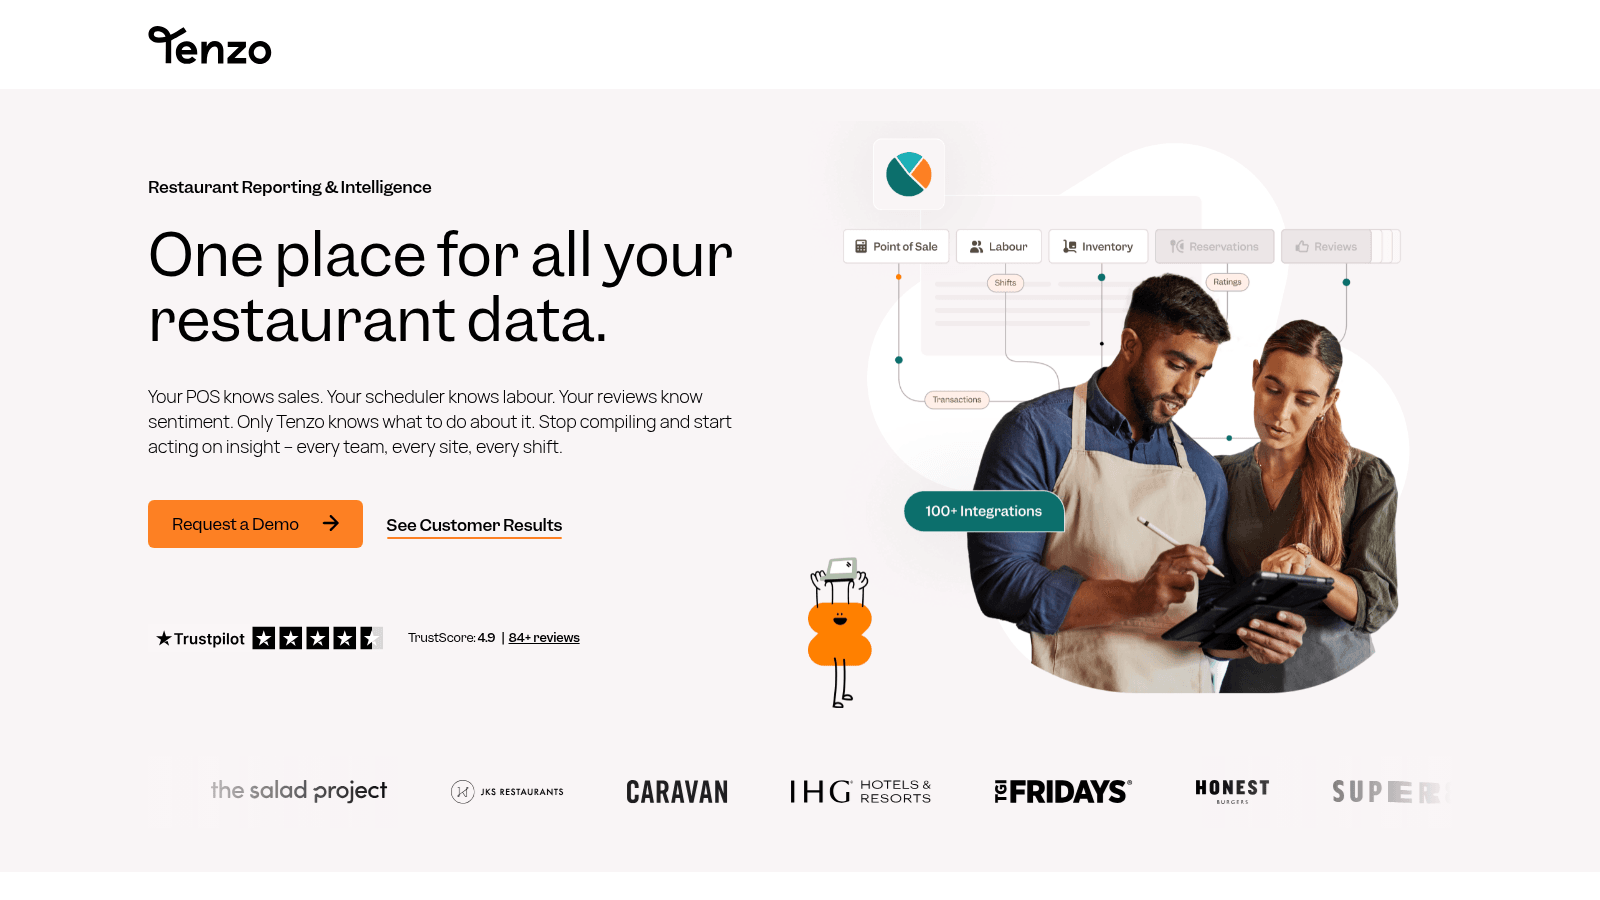
Overview: Tenzo is a dedicated reporting layer that pulls POS, labor, inventory, and review data into one place, aimed at operators whose numbers currently live in four systems that don't reconcile.
Key features:
Pricing: Quote-based with no published figures. Note that its own pricing URL does not resolve, so pricing comes through a demo.
Pros: genuinely source-agnostic rather than tied to one POS, strong consolidation, useful automated reporting. Cons: no published pricing, value depends entirely on integration quality with your specific stack, and it adds a layer rather than replacing anything.
Why it's a good restaurant analytics software: it's built for the common case of data scattered across systems that were never designed to talk. Final verdict: the strongest dedicated pick when consolidation is the actual problem.
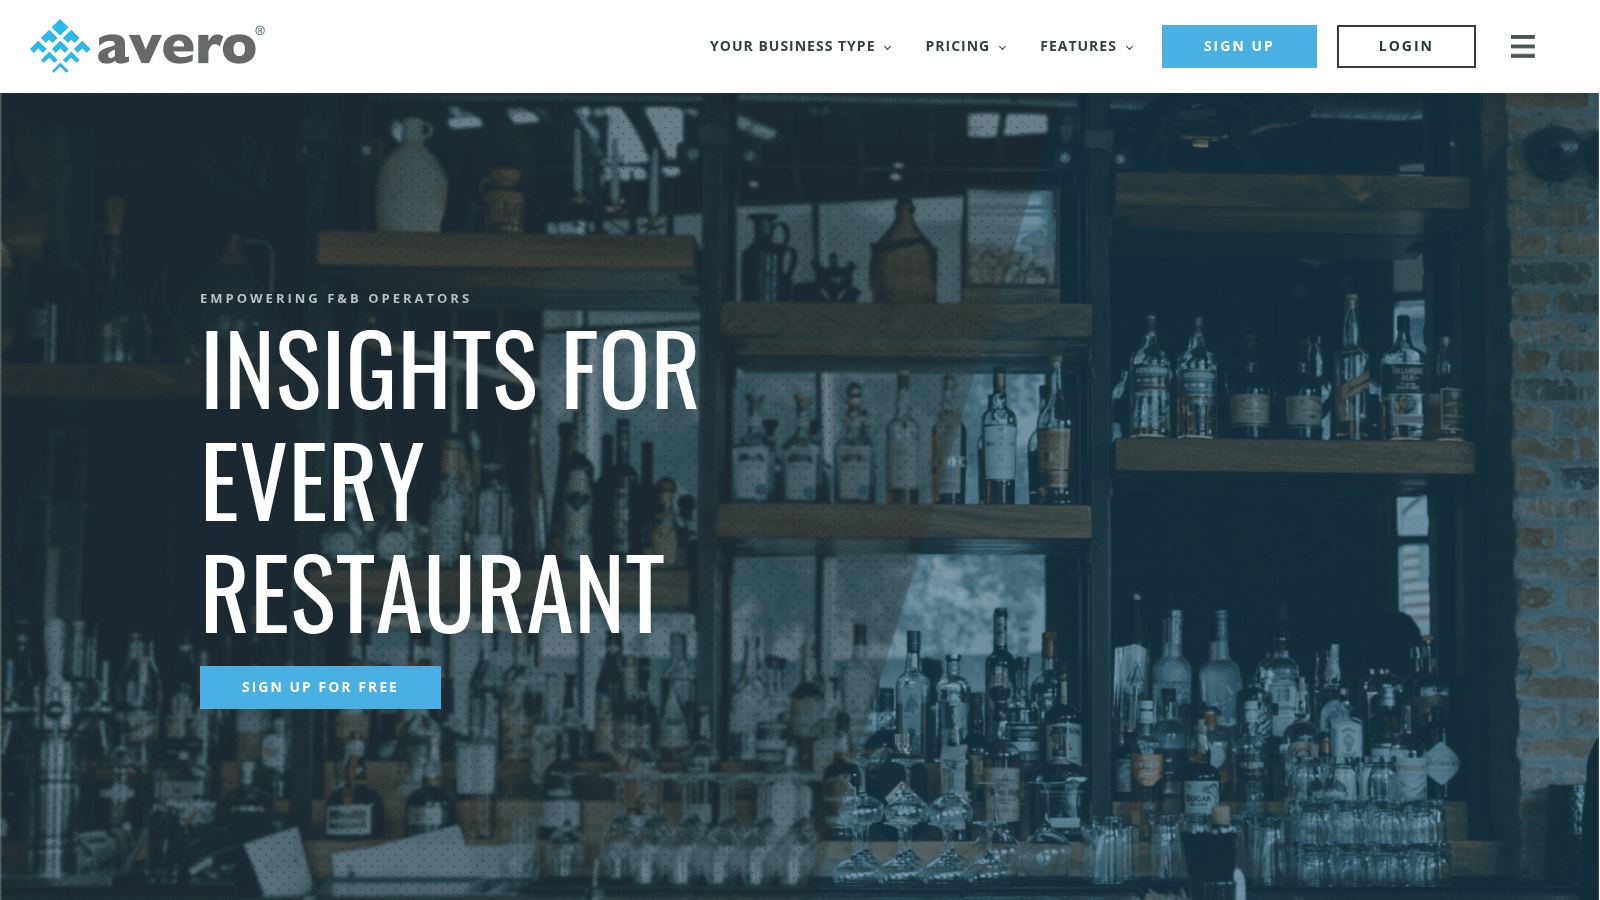
Overview: Avero focuses on revenue and performance analytics for full-service restaurants and hotel food and beverage operations, going deeper on server-level and menu-item performance than general dashboards.
Key features:
Pricing: Quote-based, with no published figures on the site.
Pros: unusual depth on server and menu performance, strong fit for hotel F&B operations, established in full-service. Cons: no pricing transparency, oriented toward full-service rather than quick-service, and narrower than a general business intelligence tool.
Why it's a good restaurant analytics software: server-level and item-level detail surfaces margin problems that daily totals hide. Final verdict: the specialist choice for full-service restaurants and hotel food and beverage teams.
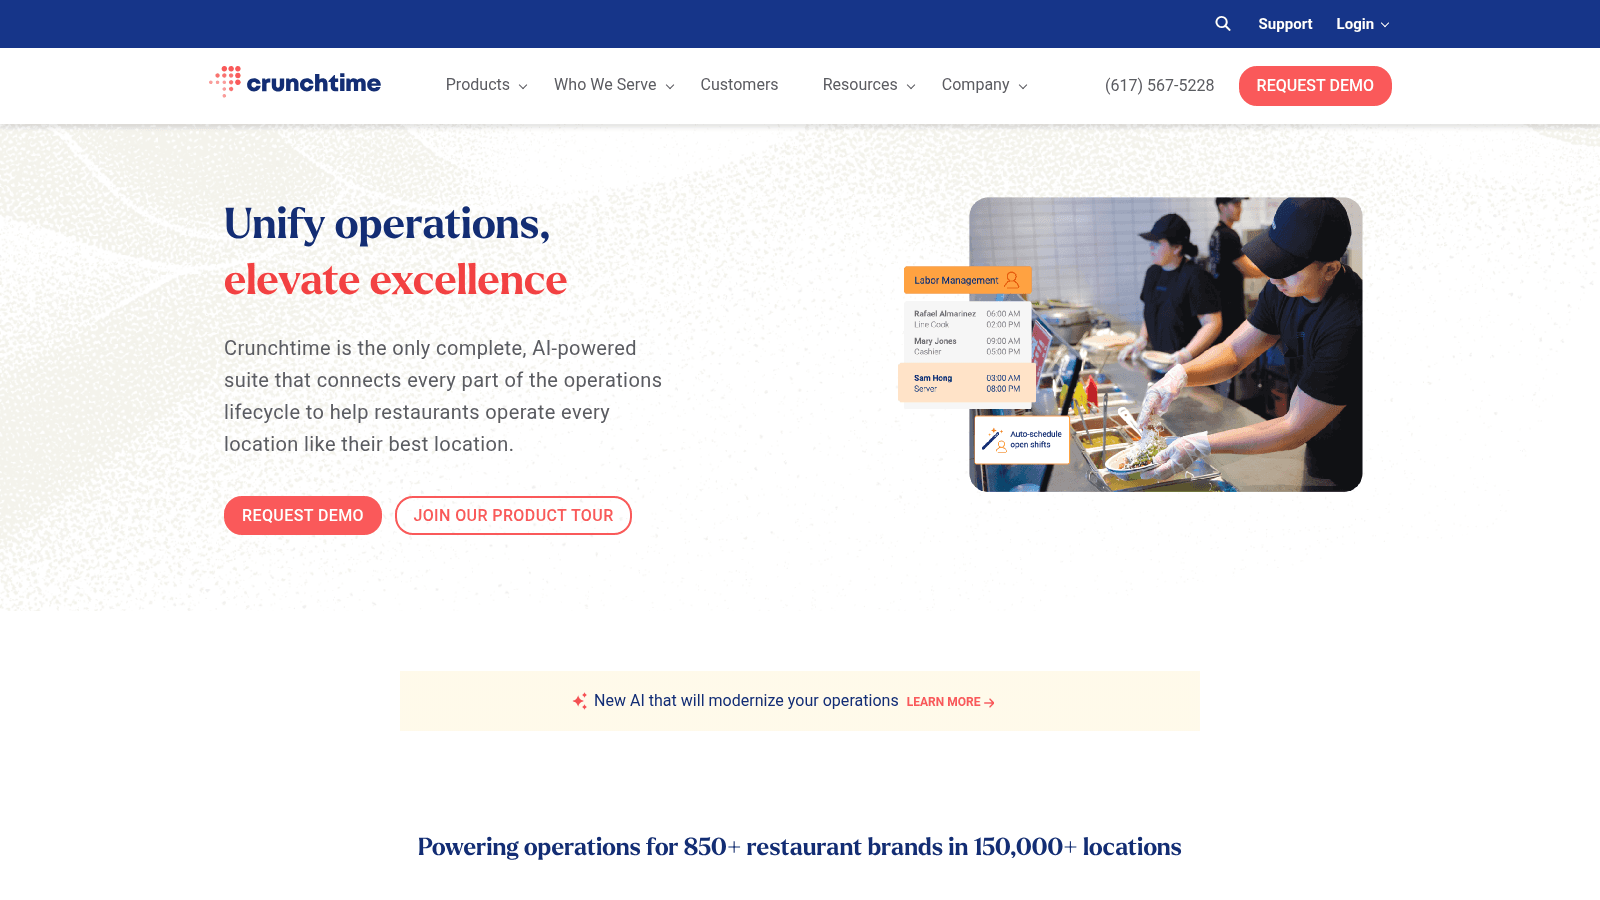
Overview: Crunchtime's analytics come from operating the underlying systems, so labor, inventory, and task completion data arrive already connected rather than integrated after the fact.
Key features:
Pricing: Quote-based with no published figures, sold through an enterprise process.
Pros: analytics from first-party data rather than integrations, genuine multi-unit benchmarking, mature at chain scale. Cons: you need to run Crunchtime's operational modules to benefit, no public pricing, and the longest sales cycle in this list.
Why it's a good restaurant analytics software: data collected by the same system that runs operations avoids most reconciliation problems. Final verdict: compelling for enterprise chains already on Crunchtime, and not worth adopting for analytics alone.
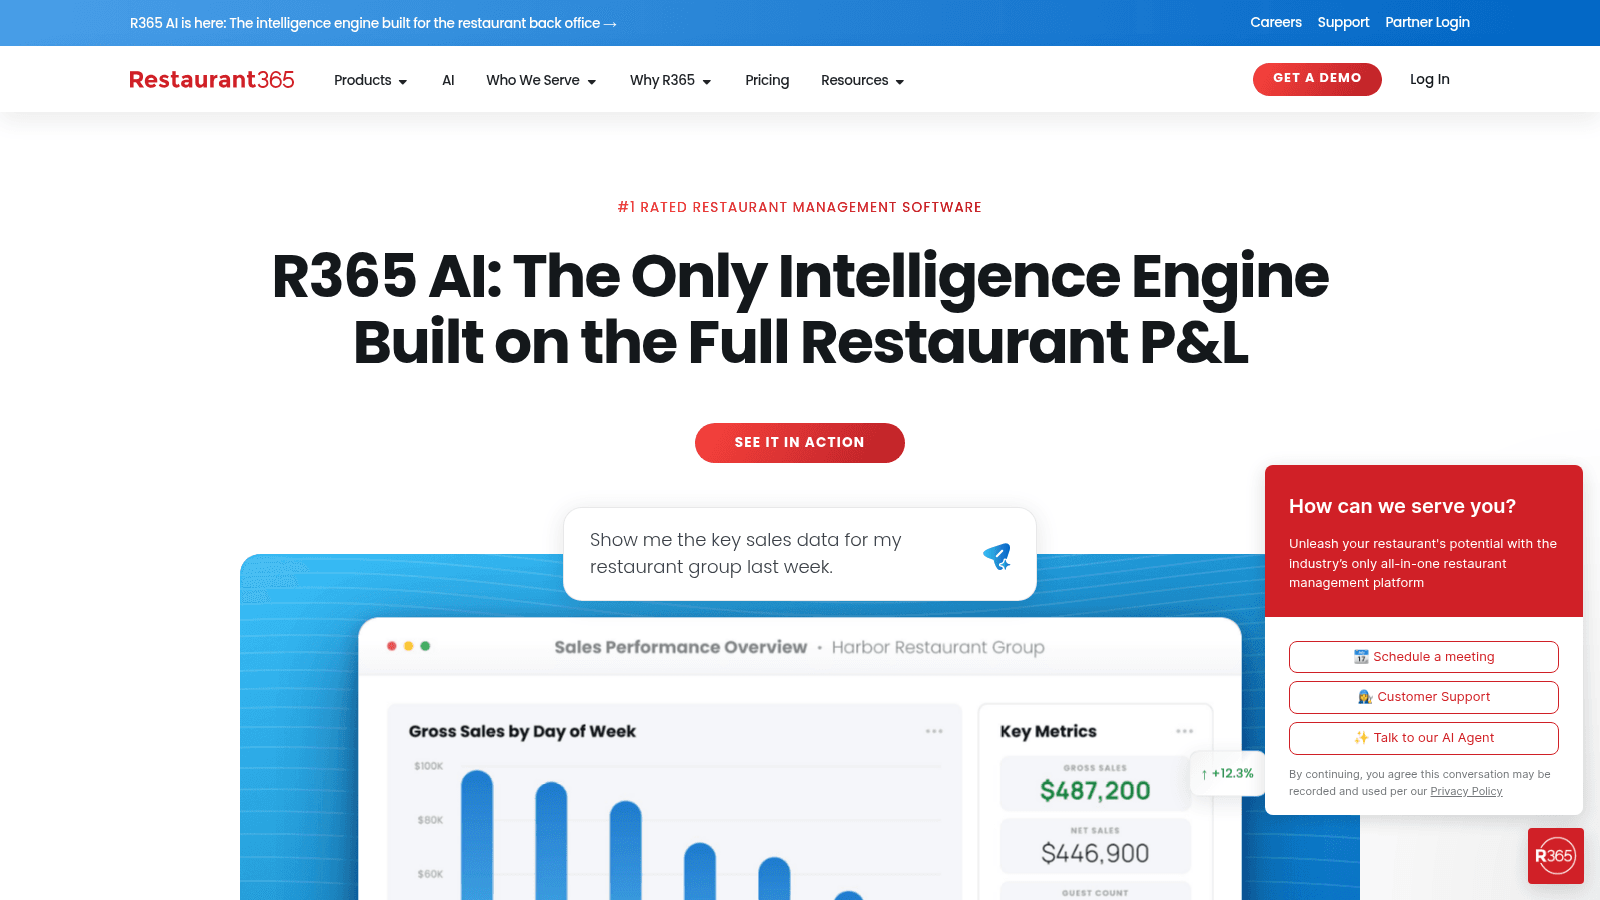
Overview: Restaurant365 approaches analytics from the accounting side, so its reporting ties operational activity to actual financial results rather than to operational proxies.
Key features:
Pricing: Custom and modular after a demo. Older articles citing a $399 monthly plan are out of date; the live page offers only a custom quote.
Pros: analytics grounded in real financial data, strong multi-location consolidation, meaningful budget comparison. Cons: requires committing to the wider platform, the heaviest implementation here, and no published pricing.
Why it's a good restaurant analytics software: financial reporting closes the gap between operational metrics and profit. Final verdict: the right analytics layer for groups that already run their accounting through it.
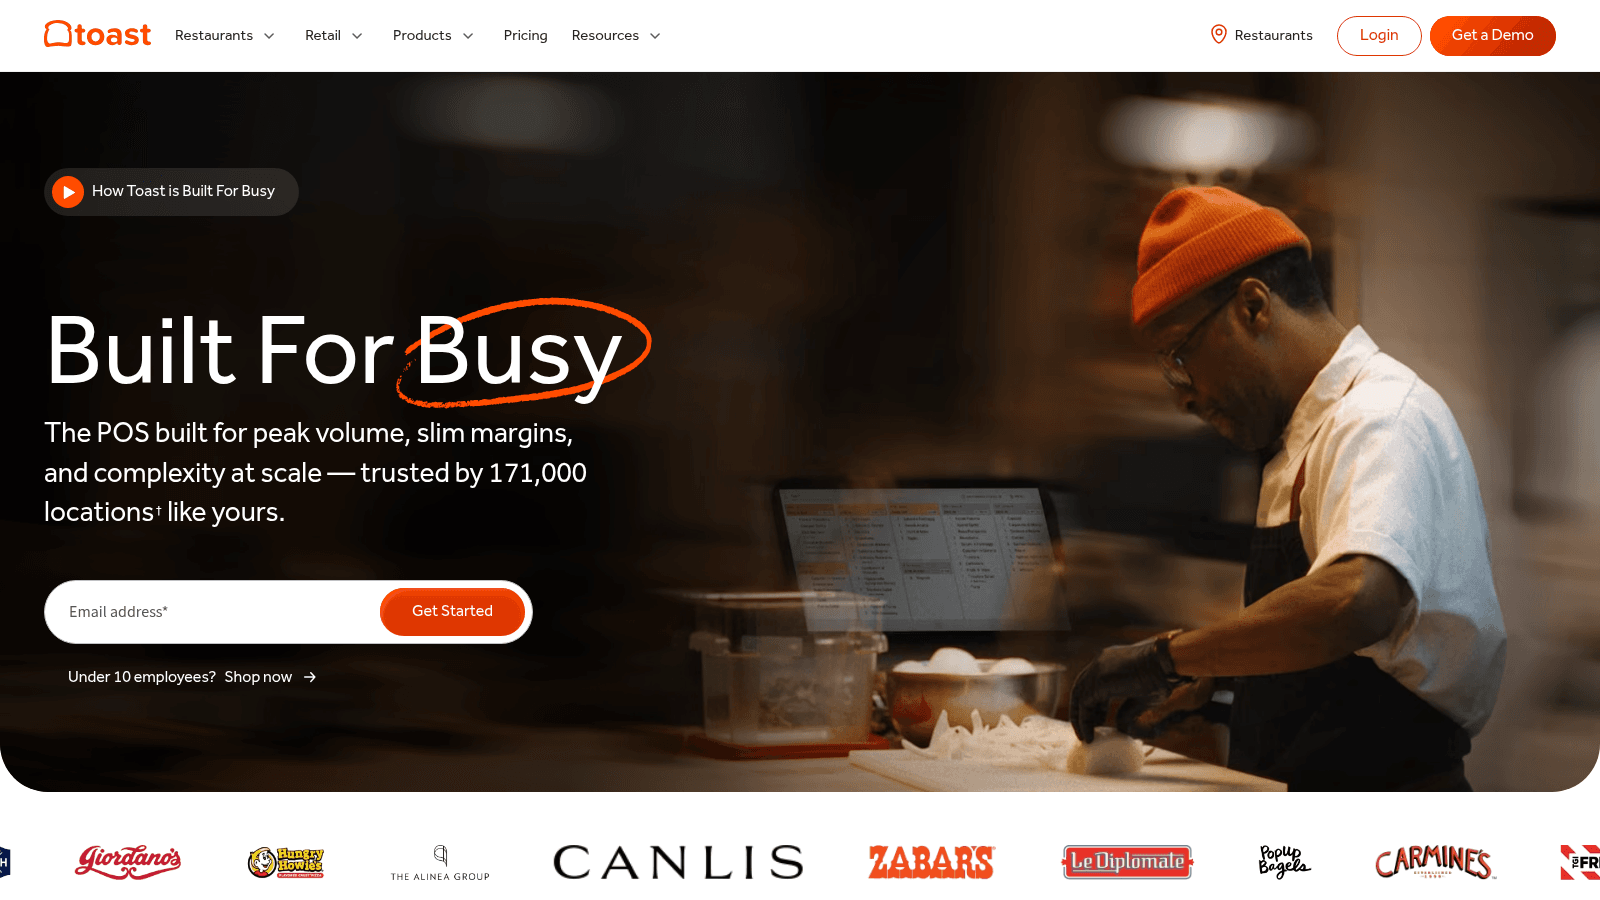
Overview: Toast's reporting is included with its POS, covering sales, labor, and menu performance without an additional purchase, which makes it the default analytics for a large share of restaurants.
Key features:
Pricing: Reporting carries no separate charge; you pay for the POS beneath it, from $0 a month on the Starter Kit or $69 for Point of Sale. Richer reporting unlocks on the higher bundles.
Pros: no extra cost if you're already on Toast, genuinely capable core reporting, no integration work needed. Cons: it only sees data inside Toast, cross-system analysis needs another tool, and advanced reporting sits behind higher tiers.
Why it's a good restaurant analytics software: for single-platform restaurants it answers most questions without another subscription. Final verdict: sufficient for many Toast operators, and limited the moment your data lives elsewhere too.
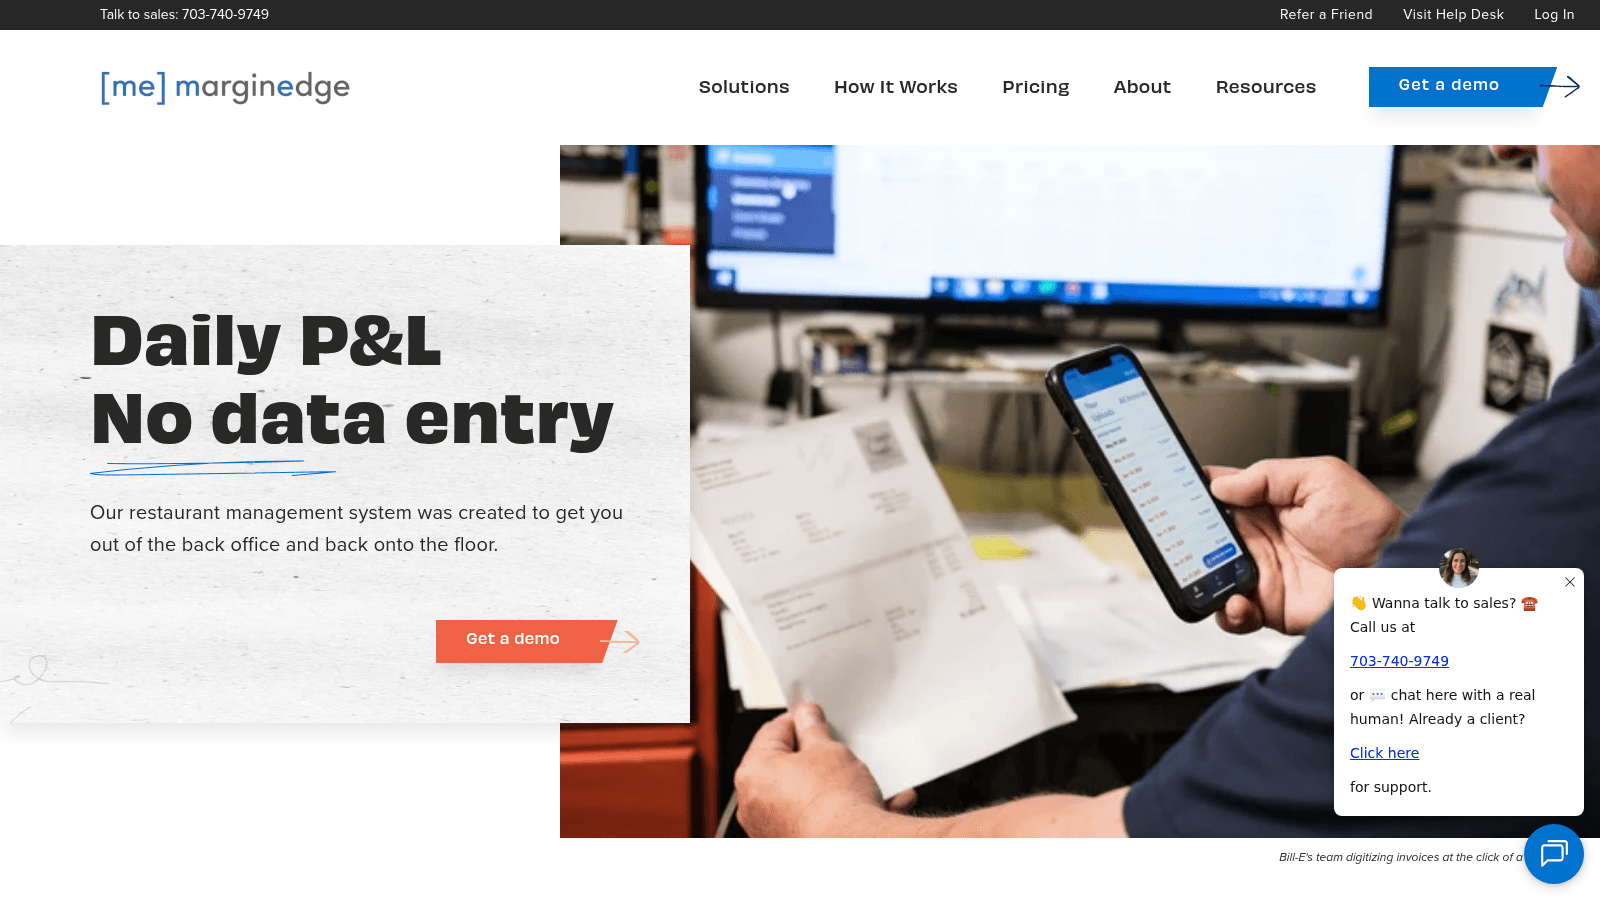
Overview: MarginEdge produces analytics as a byproduct of processing your invoices, giving daily food cost and margin visibility rather than waiting for a month-end close.
Key features:
Pricing: Billing is a single $350 per location each month with nothing gated behind tiers, discounted 10% if paid annually. Connecting it to Toast carries a separate $50 monthly fee from Toast.
Pros: genuinely daily rather than monthly cost visibility, transparent all-inclusive pricing, no manual data entry required. Cons: it analyzes cost rather than sales or labor broadly, the flat fee is significant for small sites, and it's a complement rather than a full analytics platform.
Why it's a good restaurant analytics software: knowing your food cost daily changes decisions that a month-end number arrives too late to influence. Final verdict: the best pick when margin visibility is the specific question.
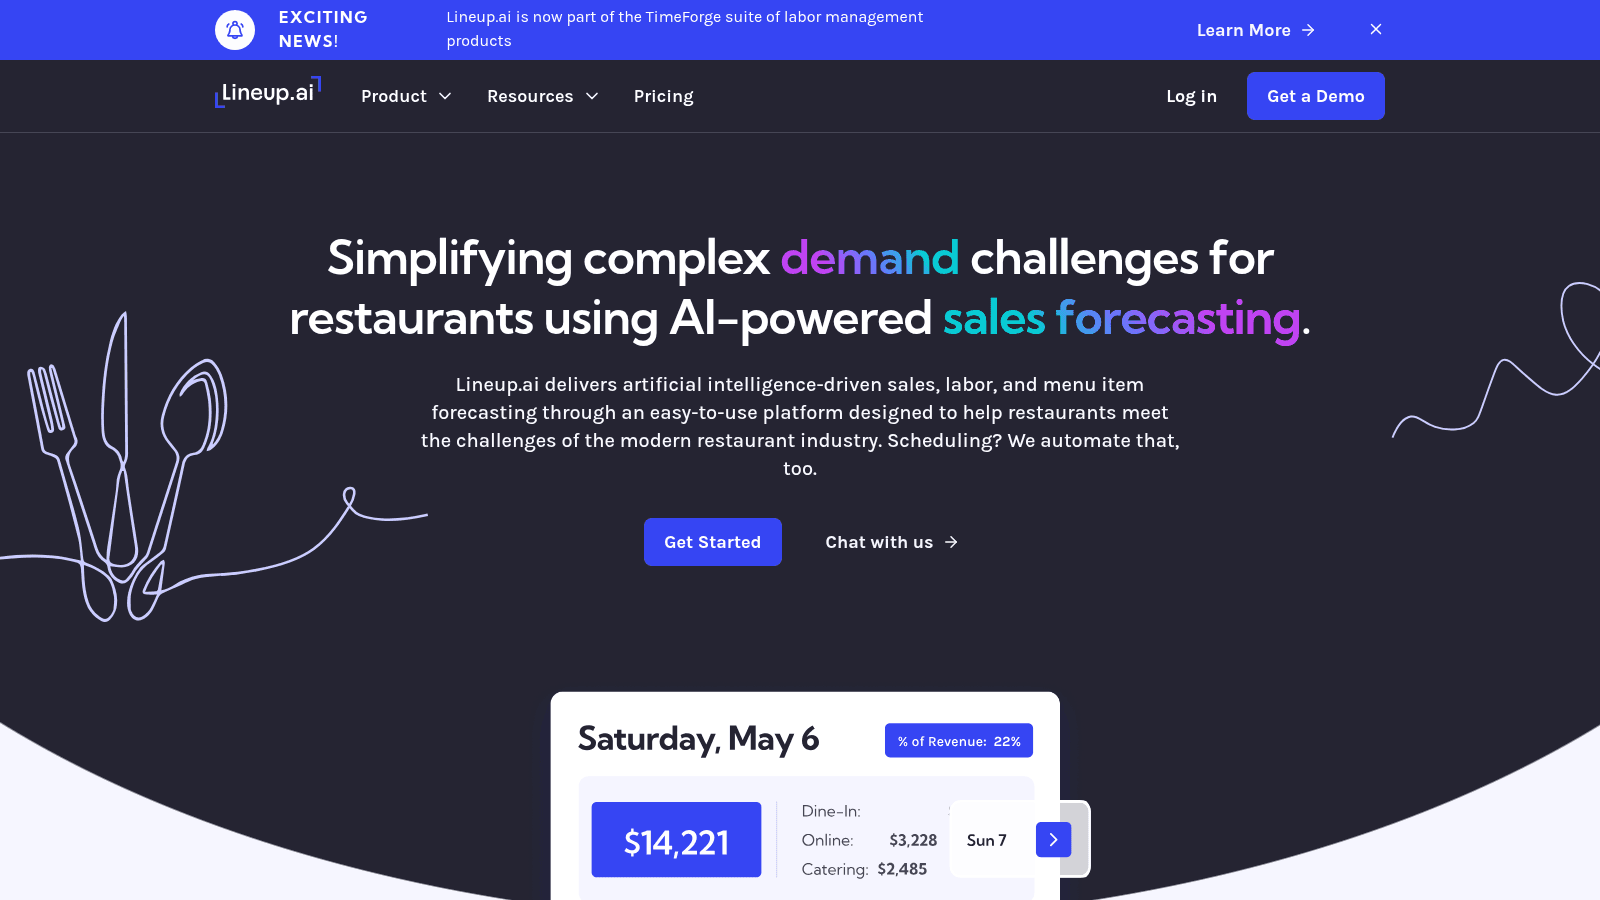
Overview: Lineup.ai, now part of the TimeForge suite of labor management products, is predictive rather than descriptive, generating item-level sales forecasts and optionally building schedules against them.
Key features:
Pricing: Two tiers, both per location per month: $79 buys forecasting alone and $149 adds scheduling on top, each discounted 10% annually. User counts are unlimited either way.
Pros: rare published pricing in this category, unlimited users at every tier, genuine forecasting depth. Cons: it forecasts rather than reporting broadly, accuracy depends on clean sales history, and newer locations get weaker predictions.
Why it's a good restaurant analytics software: a forecast changes tomorrow's decisions, where a report only explains yesterday's. Final verdict: excellent alongside a reporting tool, and not a replacement for one.
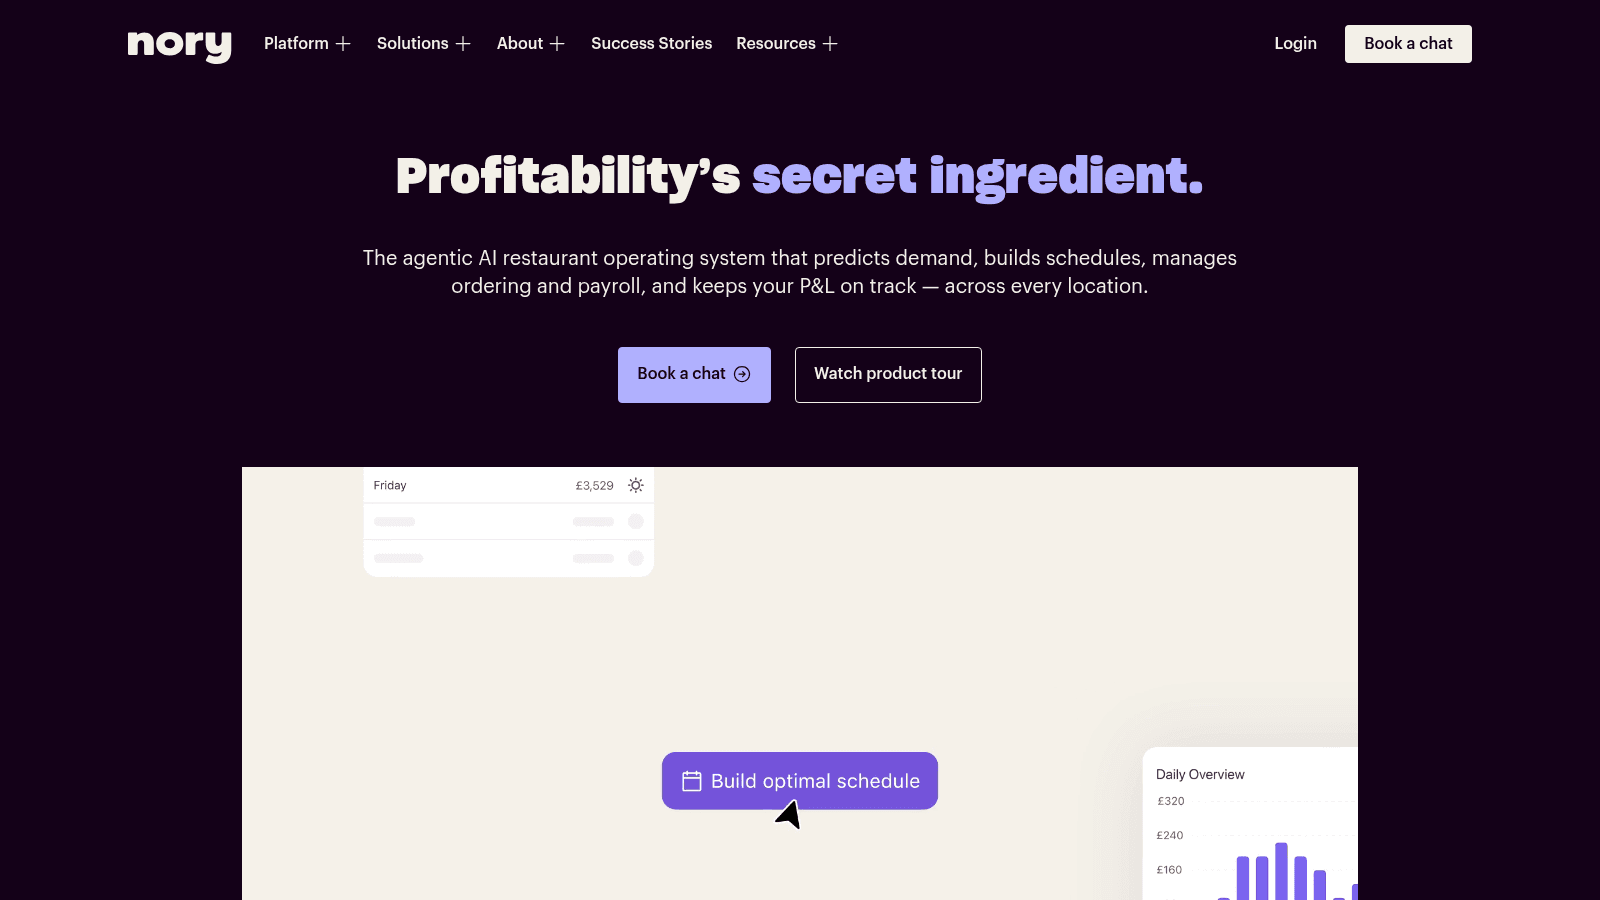
Overview: Nory combines forecasting with operational analytics for multi-site groups, presenting live per-site P&L alongside the demand predictions that drive scheduling and ordering.
Key features:
Pricing: Entirely quote-driven. Nory routes its pricing link straight to a booking form, publishing no tiers or starting figures at all.
Pros: forecasting and reporting in one system, genuine multi-site design, live financial visibility. Cons: no pricing transparency whatsoever, a smaller North American footprint, and it works best if you adopt its operational modules too.
Why it's a good restaurant analytics software: pairing a forecast with live P&L makes the analytics actionable rather than descriptive. Final verdict: worth evaluating for multi-site groups willing to go through a sales process.
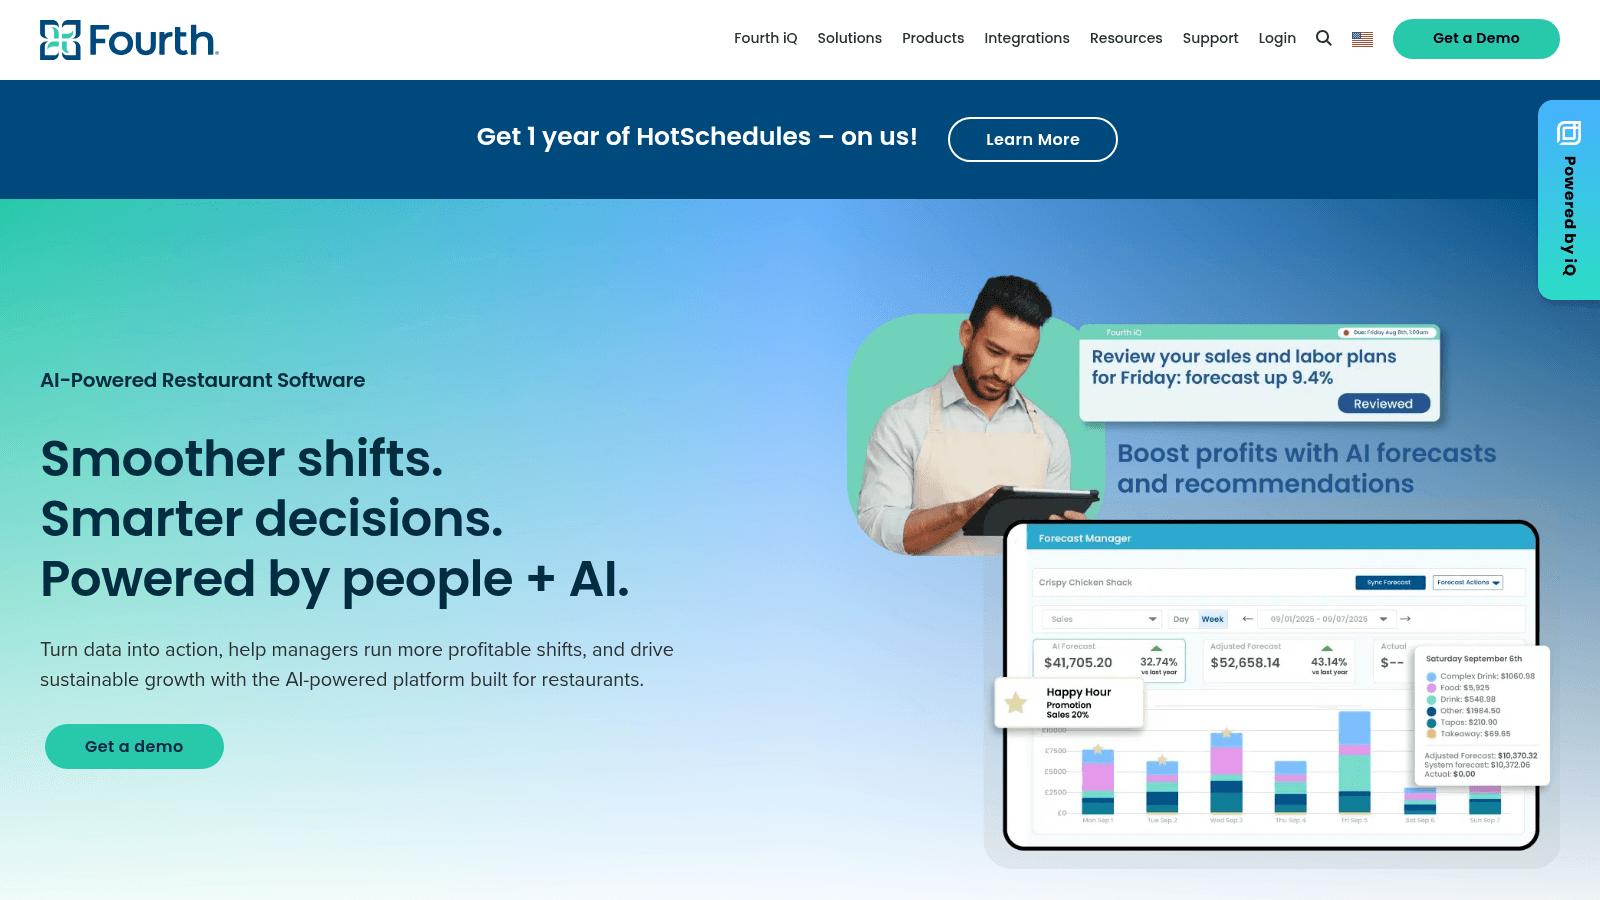
Overview: Fourth is an enterprise workforce management suite whose analytics center on labor: demand forecasting that drives scheduling, and reporting on how labor tracked against that forecast.
Key features:
Pricing: Quote-based, with no published figures.
Pros: deep labor analytics, proven at large scale, forecasting tied directly to scheduling decisions. Cons: oriented to enterprise operators, no pricing transparency, and lighter on food cost than labor.
Why it's a good restaurant analytics software: labor is the largest controllable cost, so analytics that improve scheduling accuracy pay back directly. Final verdict: a strong fit for larger operators whose main analytics question is labor.
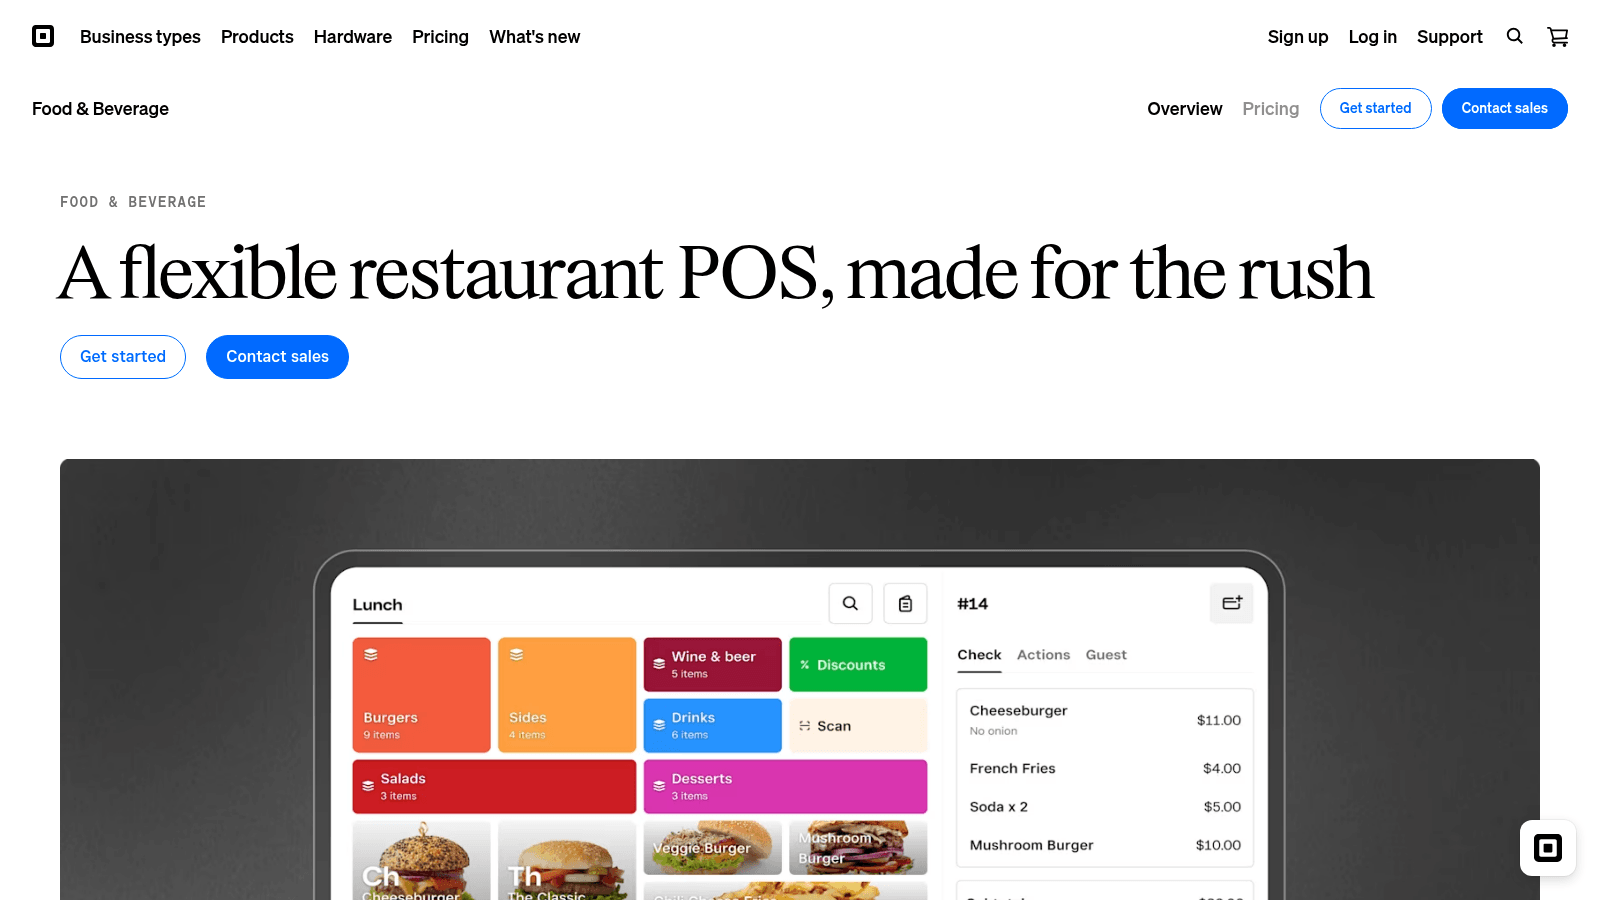
Overview: Square includes sales and labor reporting at every tier including the free one, which makes it the cheapest genuine analytics starting point for a small restaurant.
Key features:
Pricing: Reporting is included with Square Free at $0 per location monthly, Square Plus at $49, and Square Premium at $149.
Pros: real reporting available at no cost, no contract commitment, straightforward to read. Cons: shallower than dedicated analytics tools, limited to Square's own data, and multi-location analysis is basic.
Why it's a good restaurant analytics software: it answers the core daily questions without a subscription or an implementation. Final verdict: the sensible baseline for single sites, and something you'll outgrow as you add locations.
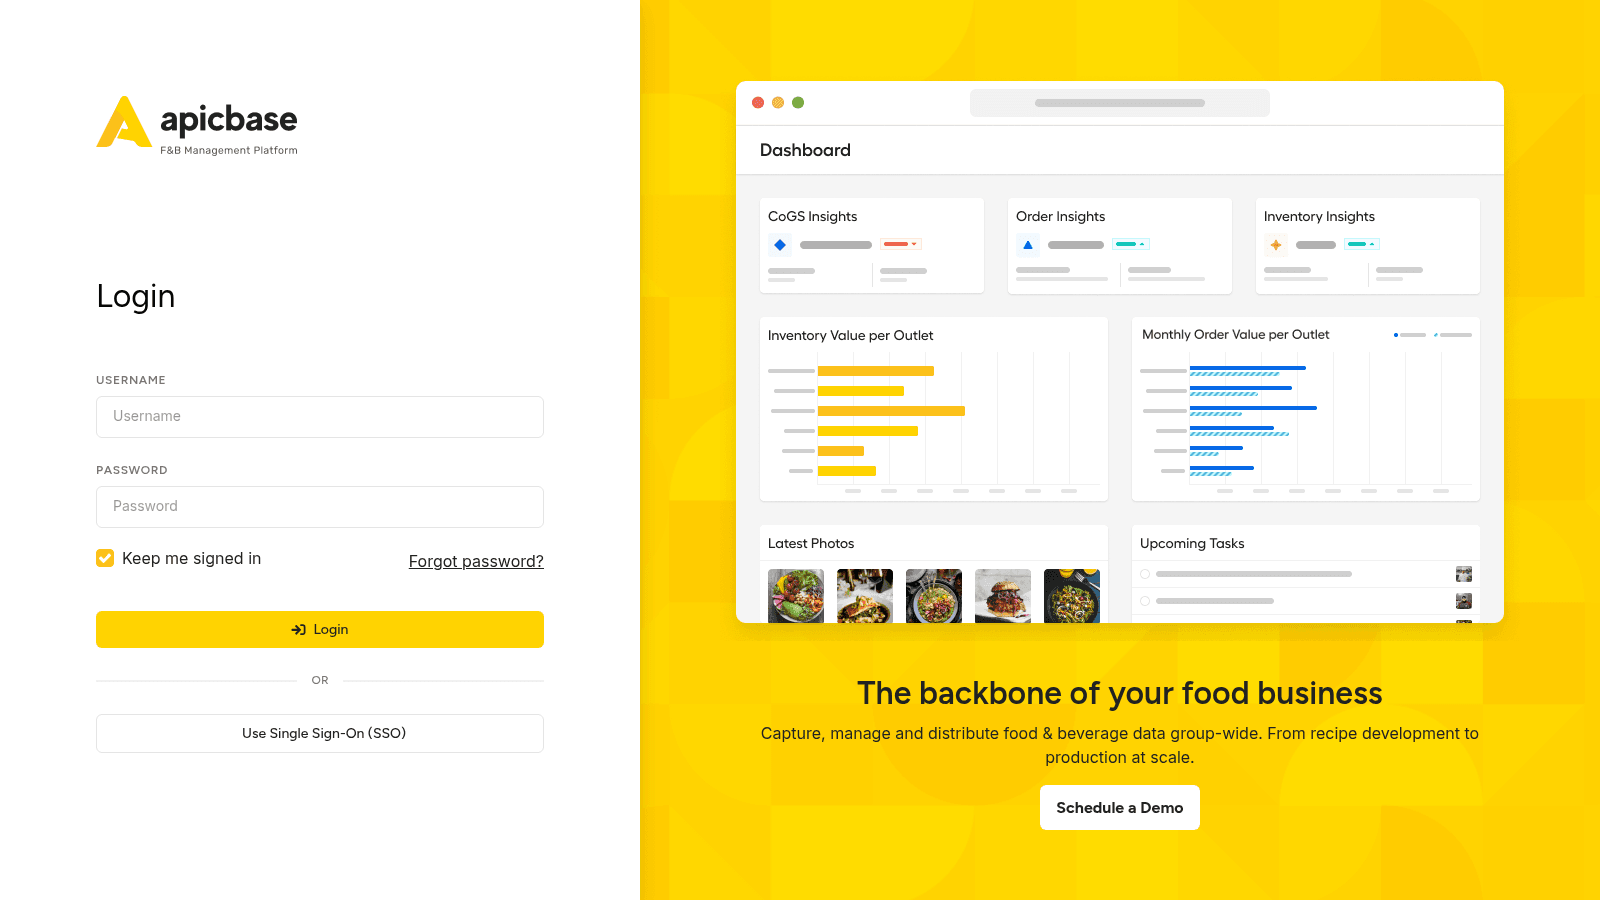
Overview: Apicbase analyzes the recipe and production layer, showing which dishes carry margin, how ingredient costs move, and what production volumes imply across multiple outlets.
Key features:
Pricing: Custom, scaled by outlet count from five outlets upward, with several capabilities sold as add-ons.
Pros: the deepest recipe-level analysis here, genuinely multi-outlet, strong allergen and nutrition data. Cons: priced by outlet so small operators fit poorly, capabilities are gated behind add-ons, and it doesn't cover labor.
Why it's a good restaurant analytics software: menu-level margin analysis is where many operators find their fastest wins. Final verdict: the pick for multi-outlet groups analyzing standardized menus.
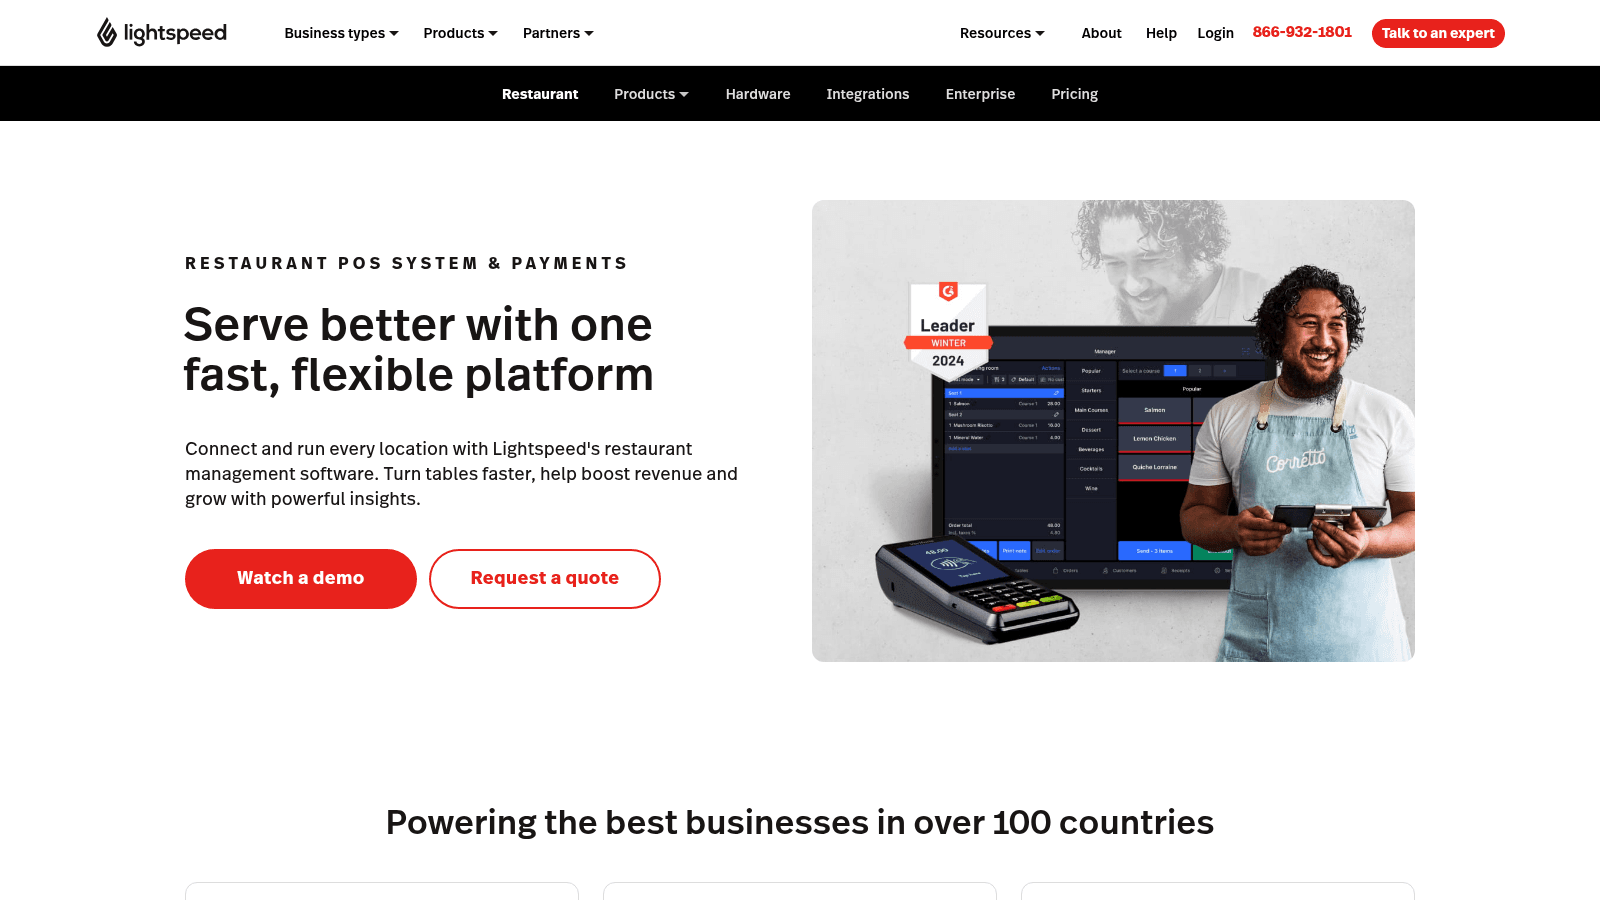
Overview: Lightspeed's analytics combine POS sales data with its inventory module, so stock movement and food cost sit alongside sales rather than in a separate system.
Key features:
Pricing: Custom across all tiers with no published figures. Inventory, which drives much of the analytics value, is an add-on at lower tiers.
Pros: sales and inventory analytics from one dataset, solid for full-service, established internationally. Cons: no published pricing, the inventory add-on is needed for the useful reporting, and it only covers Lightspeed data.
Why it's a good restaurant analytics software: connecting sales directly to stock movement explains variance that sales reports alone cannot. Final verdict: a reasonable choice for operators already committed to Lightspeed's POS.
Analytics platforms depend on the quality of the data flowing into them, and supplier ordering is one of the weakest links in that chain. When orders are placed by phone and receipts are keyed in later, the purchasing data underneath your food cost analysis carries whatever errors crept in along the way.
VoiceOrder Solutions is not an analytics tool and does not report on anything. It handles the ordering step itself: staff speak an order into an app, and it is digitized, confirmed, timestamped, and transmitted to the distributor automatically, with a unique order number and date on every one.
The relevance to analytics is upstream. Orders that were captured accurately and timestamped at the source produce cleaner purchasing records than orders reconstructed from a phone call and a delivery note. The same timestamps are what purchase order tracking software reads to show where an order sits between submitted and delivered.
For restaurants whose cost analysis keeps running into disputed or mis-keyed orders, VoiceOrder Solutions addresses the input rather than the dashboard. It suits food service operators running several sites, and you can book a demo to see the order record it produces.
Every platform here was verified live in August 2026, with its category claim checked against what the product actually does. One vendor was dropped after its site turned out to have become a client login router following an acquisition, which is not something a buyer should be sent to.
We included built-in analytics alongside dedicated platforms deliberately. Many operators asking about analytics software already own capable reporting inside their POS, and recommending a new subscription without mentioning that would be poor advice.
Where pricing is published we quote the live figure. For most of this category that meant recording quote-based, which is an honest description of a market where even entry-level analytics tools gate their pricing behind a demo.
Dashboards are easy to fill and hard to use. The test of an analytics tool is whether it changes a decision, not how many charts it renders.
The questions worth being able to answer quickly are these:
If a tool cannot answer those without an export to a spreadsheet, it isn't giving you analytics. It's giving you storage with a chart library attached.
Start by mapping where your data currently lives. If sales, labor, and inventory all sit inside one platform, the built-in reporting is probably adequate and a dedicated tool adds cost without adding much insight.
If your data is genuinely scattered, which is the common case for operators running a POS, a separate scheduling tool, and a separate inventory system, then a consolidation layer like Tenzo earns its cost by making cross-source questions answerable at all.
Then decide between describing and predicting. Reporting tools explain what happened and suit operators who need visibility. Forecasting tools like Lineup.ai, Nory, and Fourth predict what's coming and suit operators whose problem is planning labor and prep.
Scale sets the last constraint. Single sites do well with built-in reporting from Square or Toast. Multi-unit groups need benchmarking across locations, which is where dedicated platforms and suites justify themselves.
This is the least transparent software category a restaurant operator is likely to shop for, with two-thirds of the tools here refusing to publish a number.
| Tool | Published pricing | What you get |
|---|---|---|
| Square for Restaurants | $0 / $49 / $149 per location | Reporting included with POS |
| Toast | $0 / $69 per month | Reporting included with POS |
| Lineup.ai | $79 / $149 per location | Forecasting, optionally scheduling |
| MarginEdge | $350 per location | Food cost analytics, all-inclusive |
| Tenzo, Avero, Crunchtime, Restaurant365, Nory, Fourth, Apicbase, Lightspeed | Quote only | Demo required |
The pattern is clear enough: analytics bundled into a platform you already pay for is cheap or free, while dedicated analytics is quote-based and priced per location after a sales conversation.
That makes the build-versus-buy question sharper than usual. Before paying for a dedicated layer, confirm your existing tools genuinely can't answer your questions, because operators frequently buy consolidation they didn't need and leave capable built-in reporting unopened.
The uncomfortable truth about this category is that most analytics disappointments are data problems wearing a software costume.
Item names that differ between your POS and your inventory system break every cross-source report. Supplier prices entered weeks late, rather than captured through invoice software, make food cost analysis describe a period that has already passed. Counts done inconsistently across locations make benchmarking meaningless.
The costs involved are not trivial. The National Restaurant Association reported that full-service food and non-alcohol beverage costs ran a median of 32.0% of sales in 2024, so analysis built on unreliable purchasing data is misreading roughly a third of your cost base.
Deloitte found 55% of restaurant leaders already use AI in inventory management daily, but only around 20% felt their AI risk and governance was adequately in place. Automated analysis is spreading faster than the discipline to check it.
Fix the inputs before buying a better dashboard. Standardize item names, get invoices in within days rather than weeks, and make inventory counts consistent, then judge whether you still need another tool.
Analytics projects fail by trying to measure everything at once. Pick the single decision you make weekly on instinct and instrument that first.
For most operators that decision is the schedule, which makes labor-versus-sales the first report worth trusting. For others it's the order, which puts food cost, restaurant automation, and supplier price movement first.
Get one report accurate enough that you'd act on it without checking, then add a second. A single trusted number beats a dashboard of twelve that nobody quite believes.
If your purchasing data is the part you don't trust, that's an input problem rather than an analytics problem, and it's worth fixing at the source before you shop for a better view of it.
Often not. If sales, labor, and inventory all run through one platform, built-in reporting from Toast, Square, or Lightspeed answers most operational questions at no extra cost. Dedicated analytics earns its price when data is genuinely scattered across systems that don't share item names or time periods, which is when cross-source questions become impossible rather than merely inconvenient.
Reporting shows what happened, usually as totals and comparisons against a prior period. Analytics explains why and, in predictive tools, what is likely to happen next. A sales report tells you Saturday did $14,000. Analytics tells you that came from higher covers rather than higher spend, and that your labor ran 4% over because the schedule assumed the opposite.
Descriptive reporting works immediately, since it only summarizes what you already have. Forecasting needs roughly a year of history to handle seasonality properly, and reliable predictions usually require several months at minimum. A location open three months will get poor forecasts from any tool, which is a data limitation rather than a vendor failing.
Because pricing depends on location count, data sources, and integration complexity, which vary enormously between a single restaurant and a 40-unit group. Eight of the 12 tools here are quote-only. Plan for a demo cycle with two or three vendors and ask each for pricing at your specific location count rather than a general range.
Only through the decisions it changes. Analytics that surface a low-margin menu item or a supplier price increase are useful when someone acts on them, and inert when the report goes unread. The operators who see returns tend to be those who tie a specific weekly decision to a specific report, rather than those who buy a dashboard and hope insight follows.