.webp)
Key takeaways:
Ask a warehouse manager how much stock they have and you will usually get two answers: what the system says, and what is actually on the floor. The gap between those two numbers is your inventory accuracy problem, and it quietly drives stockouts, overstock, lost sales, and distorted financials.
Getting it right is not about chasing a perfect number. It is about measuring accuracy the right way, understanding why records drift, and fixing the process rather than just correcting the count. This guide covers the inventory accuracy formula, how to calculate and measure it, realistic benchmarks, the KPIs that matter, and the practices that actually move the number in 2026.
Inventory accuracy is the degree to which your recorded inventory matches the physical stock you actually hold. If your system says 100 units of a SKU and you count 92 on the shelf, that record is inaccurate, and every decision made from it, reordering, promising stock to a customer, valuing your inventory, inherits the error.
The cost of getting it wrong is enormous in aggregate. IHL Group estimates the global retail industry loses $1.73 trillion a year to inventory distortion, the combination of out-of-stocks and overstocks, equal to 6.5% of global retail sales. Much of that traces back to records that do not match reality.
Accuracy also feeds your books. Inaccurate stock counts distort your cost of goods sold and inventory valuation, which means a records problem quietly becomes a financial-reporting problem. That is why accuracy is worth measuring precisely rather than eyeballing.
Inaccurate inventory is expensive in ways that compound. IHL Group breaks its distortion figure down further: supply-chain disruption is the single largest driver at $301 billion a year, and theft or organized retail crime adds another $379 billion. Those are industry totals, but the same forces hit a single operation's P&L.
On your own books, the cost shows up as stockouts (lost sales when the system claims stock you do not have), overstock (cash tied up because records looked low and you over-ordered), and shrinkage you cannot explain. Each traces back to records that did not match reality.
Technology compounds both the problem and the fix. McKinsey found AI-driven forecasting can cut supply-chain forecasting errors by 20 to 50% and reduce lost sales from unavailability by up to 65%, but those gains depend on accurate underlying data. Feed a smart forecast bad counts and it optimizes the wrong picture, which is why accuracy is the foundation, not an afterthought.
There are two inventory accuracy formulas in common use, and they answer slightly different questions. The first is the simple ratio; the second is stricter and harder to game.
The simple formula is counted items divided by items on record, times 100:
`Inventory accuracy = (Counted items / Items on record) x 100`
The variance formula subtracts total absolute variance from your recorded total, which stops overages and shortages from cancelling each other out:
`Inventory accuracy = [1 - (Total absolute variance / Total recorded inventory)] x 100`
NetSuite's worked example makes the difference concrete. A bike-parts maker records 1,000 / 200 / 100 / 100 / 200 units across five SKUs and physically counts 875 / 198 / 97 / 100 / 212. The simple ratio lands at 92.6%, but the variance method, treating both the shortages and the overage of 12 as errors, comes out lower at 91.1%.
| Method | What it measures | Same-data result |
|---|---|---|
| Simple ratio | Counted vs recorded, errors can cancel | 92.6% |
| Variance formula | Absolute error, nothing cancels | 91.1% |
The lesson is to know which formula a number came from before you trust it. The variance method is the more honest measure of how far off your records really are, so it is the one to standardize on for a true picture.
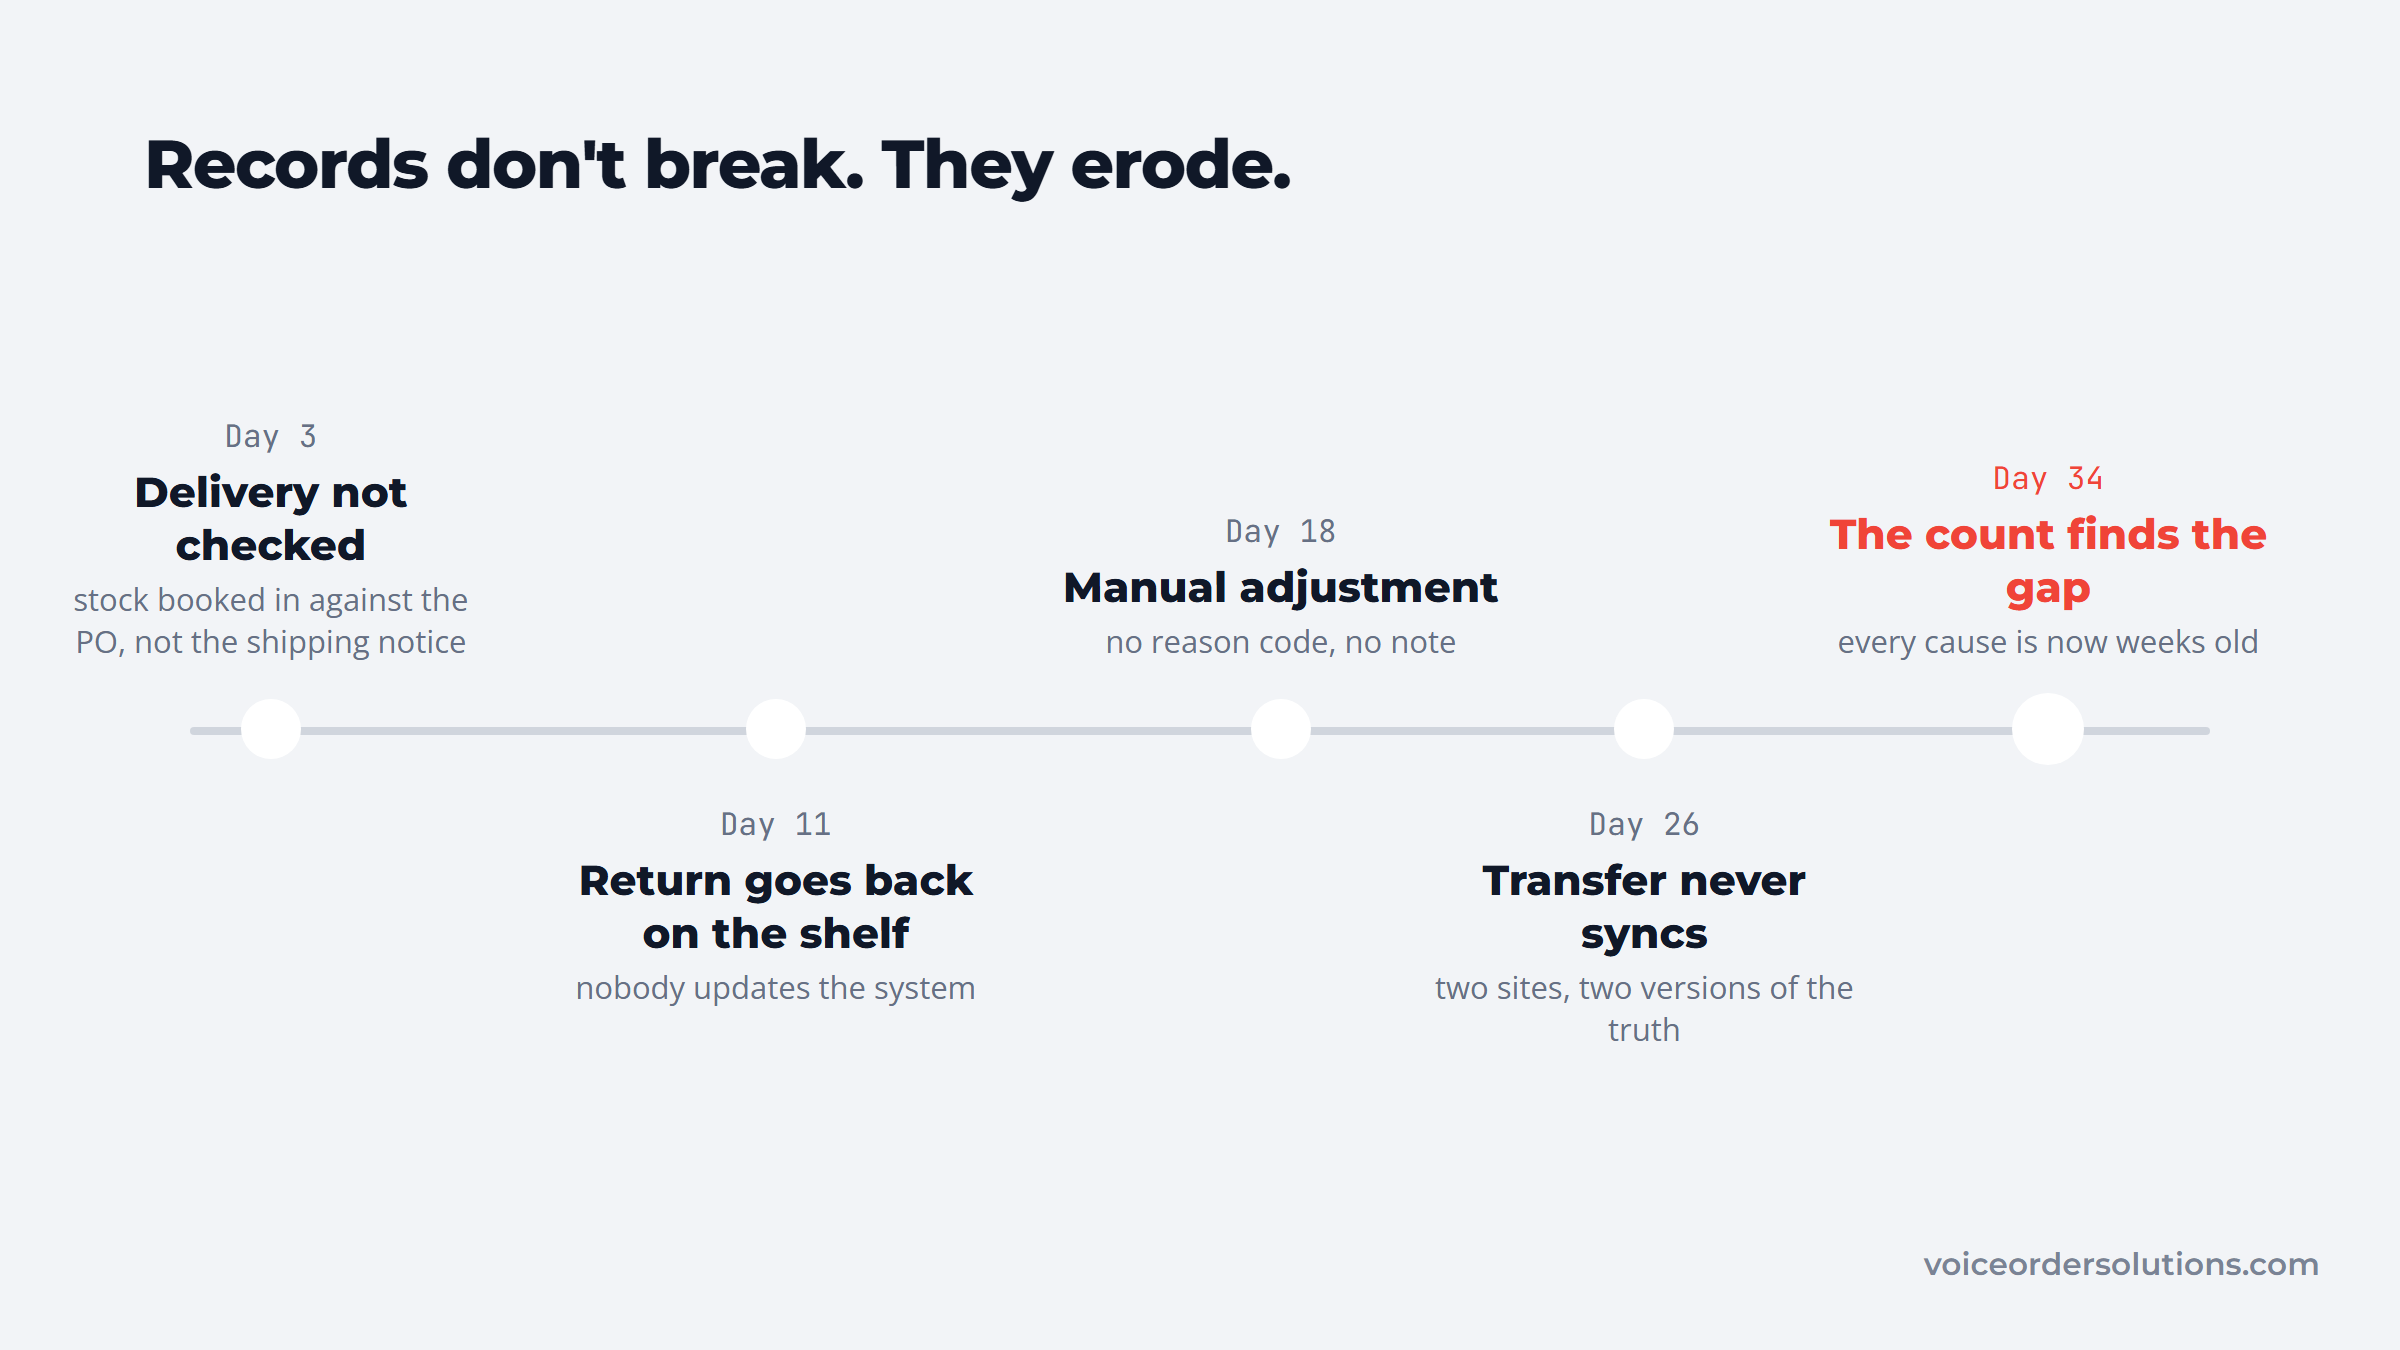
Records rarely break in one dramatic failure. They erode gradually: a receiving error here, an unreconciled return there, a manual adjustment nobody documented, a transfer that never synced. By the time a count reveals the gap, the causes are weeks old and hard to trace.
Laid out on a calendar, the erosion is easier to recognize than any single error is.
Across every serious source, the single most common root cause is manual data entry. Someone keys a count wrong, transposes a number, or records an order that never matches what shipped. Order intake is a frequent culprit: when a procurement order is phoned in and transcribed by hand, the error enters your records before the goods ever move.
This is exactly where accurate capture helps. Tools like VoiceOrder Solutions let staff speak an order into an app that digitizes, confirms, and timestamps it automatically, so the order record reflects what was actually ordered instead of a mis-keyed voicemail. Clean order data at the source means fewer discrepancies to reconcile later.
The other recurring causes are worth naming so you can target them: receiving stock without checking it against the shipping notice, returns that go back on the shelf without a system update, and manual adjustments made without a reason code. Each is a process gap, not a one-off mistake, which is why fixing the process beats fixing the count.
Learning how to calculate inventory accuracy is the easy part; choosing the right measurement method is what separates a useful number from a misleading one. The independent consultant Dave Piasecki lays out several methods, and they can produce very different results from the same data.
To measure inventory accuracy in practice, pick a timeframe, do a physical count, compare it to the system record, apply your chosen formula, and investigate every variance before adjusting. The investigation is the point: measuring how to measure inventory accuracy without chasing the cause just resets the number until it drifts again.
For most operations, tracking the absolute variance formula as your headline number, backed by periodic net-dollar checks for finance, gives the truest picture without drowning in metrics.
How often you measure matters as much as how. High-value A items may warrant weekly checks, while slow-moving C items can wait months. For a fast read between full counts, run an accuracy audit: physically count a small representative sample, extrapolate the error rate, and treat a rising number as an early warning that something upstream has slipped.
Benchmarks for inventory accuracy vary wildly, and the numbers are not interchangeable, so it helps to anchor on the credible ones. The most trustworthy industry figure comes from CAPS Research, cited by NetSuite: the 2024 average was 83%, and only 69% of companies even track accuracy at all.
Against that baseline, 90% is a reasonable "good" target and 95% is world-class for most operations. Warehousing bodies push higher: WERC research puts good accuracy at 99% and best-in-class (the top 20%) at 99.888%. The right target depends on your goods, high-value or regulated items demand tighter control than low-cost bulk stock.
| Benchmark | Rate | Source |
|---|---|---|
| Industry average (2024) | 83% | CAPS Research |
| Good | 90% | NetSuite benchmark |
| World-class | 95% | NetSuite benchmark |
| Best-in-class (top 20%) | 99.888% | WERC |
Treat vendor-published "customer average" numbers with caution. ShipBob cites 99.6% and a WMS vendor reports 99.88% among its own users, but those reflect companies that already adopted that vendor's tooling, not the broader industry, which CAPS pegs far lower. On Reddit, one operator sharing a real 1.6% variance was told it was "stellar," with a practical rule of thumb that high-value goods should run near 99% while lower-value stock is fine around 95%.
The headline accuracy rate is one number, but a mature operation watches a small set of inventory accuracy KPIs so it can see not just whether records are off, but where and how much. Record accuracy alone will not tell you that.
Pair your accuracy rate with shrinkage (stock lost to theft, damage, or error), cycle-count accuracy by location or category, and fulfillment-side metrics like mis-ship rate. One warehouse benchmark report found that cutting mis-ships below 1% saved roughly $50,000 a year at about $400 per incorrect shipment, which turns an abstract accuracy goal into a dollar figure.
One of those numbers can look healthy while the floor tells a different story.

There is also a gap the formula alone misses, and it shows up on the floor. On Reddit, a distributor running 98% cycle-count accuracy still could not find items the system showed as available. As one reply reframed it, quantity accuracy (what the report measures) and available-to-pick accuracy (what the picker experiences) are two different metrics; in a 20,000-pallet warehouse, 98% still means about 400 pallets are effectively missing at any moment.
The takeaway is to measure accuracy as a set of related signals, not a single vanity percentage. Set a target for each one, review them on the same cadence, and watch the trend rather than any single reading; a number improving month over month tells you more than one impressive snapshot. A clean headline number that hides location chaos is worse than a slightly lower number you actually trust. Inventory visibility software is what stops that chaos hiding, by putting every site on one live number.
Improving inventory accuracy is mostly about tightening a handful of processes, not buying one magic tool. The inventory accuracy best practices below appear in nearly every credible source, and they compound when used together.
Frequency beats intensity, since small regular counts catch drift while it is still cheap to fix.
Done consistently, cycle counts alone move most operations from the low-80s toward the mid-90s.
The best counts still lose to bad data, so stop errors before they ever reach the record.
Capture beats correction: data caught cleanly on the way in never becomes a variance to chase later.
Accuracy in one system is worthless if another disagrees, so close the gaps between them.
Barcode scanning and real-time sync do the heavy lifting, but the discipline that makes them stick is root-cause investigation. Fixing why a count was wrong, rather than just correcting it, is what keeps accuracy from sliding back.
Of all the practices above, cycle counting is the one that most reliably keeps accuracy high, because it turns counting from a disruptive annual event into a steady routine. Instead of shutting down for a full physical count, you count a slice of your inventory every day so problems surface while they are small.
The most common approach is ABC (Pareto) cycle counting. Your A items, often 10 to 20% of SKUs but 70 to 80% of value, get counted most frequently; B items less often; C items least. To size the program, divide your planned counts by total items: 600 counts across 1,200 items means each item is counted about once every two years, which tells you quickly whether your frequency is high enough. Counting frequency is one lever among several in inventory control, and the others are cheaper to pull first.
Run the count the same way every time: count blind where possible, flag discrepancies immediately, and route each variance to someone who investigates the cause. A well-run cycle-count program does more than fix numbers; it exposes the broken receiving step or the mislabeled bin that was generating the errors in the first place, so accuracy improves structurally rather than temporarily.
Inventory accuracy is not a project you finish; it is a discipline you maintain. Measure it with the stricter variance formula so the number is honest, anchor your target to reality (90% good, 95% world-class) rather than a vendor's marketing figure, and treat every variance as a clue about a process, not just a number to correct.
The biggest, cheapest gains come from cutting manual entry and counting more often in smaller batches.
Whether the fix is barcode scanning at receiving, standardized checks against the shipping notice, or clean, digitized order capture at the source, the pattern is the same: get the data right where it enters the system, and far fewer discrepancies reach your shelves. Operators looking to remove manual order entry from that chain can contact VoiceOrder Solutions to see how voice ordering keeps order data clean.
The simple formula is counted items divided by items on record, times 100. A stricter version uses variance: 1 minus (total absolute variance divided by total recorded inventory), times 100. The variance formula reads lower because it counts both overages and shortages as errors instead of letting them cancel out, so it is the more honest measure of how far your records are off.
Pick a timeframe, do a physical count, compare it to your system record, apply the formula, and investigate every variance before you adjust. For example, if you count 15 units of a SKU your system lists as 18, accuracy for that item is 83.3%. Track absolute variance as your headline number and reserve net-dollar accuracy for finance checks.
For most operations, 90% is good and 95% is world-class, while warehousing bodies like WERC put best-in-class near 99.9%. The 2024 industry average, per CAPS Research, was only 83%, and just 69% of companies track accuracy at all. High-value or regulated goods should aim near 99%, while lower-cost bulk stock can be acceptable around 95%.
The most effective ways to improve inventory accuracy are cycle counting instead of rare full counts, barcode or RFID scanning at every touch, standardized receiving against the shipping notice, real-time system sync across channels, and cutting manual data entry. Investigating the root cause of each variance, rather than just correcting the count, is what makes the gains stick.
Beyond the core accuracy rate, track shrinkage, cycle-count accuracy by category, and mis-ship rate. Distinguish quantity accuracy (does the total match) from available-to-pick accuracy (can staff find it), since a clean report can still hide items sitting in the wrong location. Pairing these inventory accuracy KPIs gives a truer picture than any single percentage.