.webp)
Key takeaways:
Food costs are too high to keep guessing at what to order. Buy too much and it spoils in the walk-in; buy too little and you run out mid-service and lose the sale. Inventory forecasting is how you thread that needle, using what you already know (your sales history) to predict what you will actually need.
The stakes are real. ReFED estimates U.S. restaurants and foodservice spend roughly $162 billion a year on waste-related costs, and a large share of that traces back to ordering more than you sell. Better forecasting is one of the few levers that cuts waste and stockouts at the same time.
This guide covers how to use inventory forecasting in 2026 for smoother food orders: what it is and how it differs from demand forecasting, the techniques and formulas that actually matter for a kitchen, the best practices that keep a forecast accurate, and how to turn that forecast into an order that goes out right the first time.
Inventory forecasting is predicting how much stock you will need over a future period, based on past sales, trends, and outside factors like seasonality and events. It answers a simple question: how much of each item should I have on hand to meet demand without over-buying?
It is worth separating two things that get blurred. Forecasting in inventory management is the prediction, working out what you will need. Replenishment is the action, actually placing the order to restock, the step where a tool like VoiceOrder Solutions later keeps the number from getting garbled. Forecasting tells you the number; replenishment puts the number to work.
Getting the first right makes the second calm instead of chaotic. When your forecast says you will use 30 kg of chicken before the next delivery, ordering is a quick, confident decision rather than a guess made while staring at a half-empty walk-in.
Inventory planning and forecasting also is not a set-and-forget task. Demand shifts with the season, the neighborhood, and the menu, so a forecast is a living number you revisit, not a spreadsheet you build once and trust forever.
These two terms get used interchangeably, but treating them as one thing muddies your process. They are sequential steps, and demand forecasting in inventory management is the input to the inventory forecast, not a synonym for it.
Demand forecasting predicts what your customers will want: how many covers, how many of each dish. It is largely outside your control, driven by the market, the weather, and the calendar. Inventory forecasting takes that demand prediction and works out the stock consequence: how much of each ingredient to hold, and when to reorder, to service that demand without waste.
The distinction below is worth internalizing, because it tells you which lever to pull when something is off.
| Demand forecasting | Inventory forecasting | |
|---|---|---|
| Question it answers | How much will customers buy? | How much stock to hold and when to order? |
| Nature | Independent, driven by the market | Derivative, follows from demand |
| Output | Expected sales by item and day | Par levels, reorder points, order timing |
| Owner | Whoever sets the menu and reads the market | Whoever manages stock and ordering |
When you run out of an item, the fix depends on which step failed: a demand forecast that missed a busy night, or an inventory forecast that set the par level too low. Separating them tells you where to look. Most restaurant forecasting software does the first job well and leaves the second to your inventory system, so check which one you are buying.
Most inventory-forecasting advice is written for retail or ecommerce, where a product can sit on a shelf for months. Food is different, and the difference changes the math.
Perishability is the whole game. A case of romaine has days, not months, so the safe buffer of extra stock that retail guides recommend can turn into pure waste in a kitchen. The classic safety-stock formula assumes a product you can hold; for perishables, you keep that buffer deliberately small and lean on more frequent deliveries instead.
It also means a forecast has to respect rotation. Stock moves first-in, first-out, so an over-forecast does not just tie up cash the way it would in retail, it spoils on the shelf before you can sell it, which makes an accurate number matter more, not less.
Better forecasting is also a direct hit on cost. McKinsey reports that AI-driven forecasting can cut supply-chain forecasting errors by 20% to 50% and reduce lost sales from stockouts by up to 65%. In a restaurant, that shows up as less spoilage in the walk-in and fewer dishes you have to 86 on a Friday night.
The upside of shorter shelf lives is shorter lead times. Foodservice distributors often deliver in one to three days, sometimes several times a week, so you can forecast in tight windows and correct quickly, rather than committing to a month of stock at once. That makes food forecasting less about big bets and more about steady, frequent adjustment.
Your sales history is the foundation of every forecast, and forecasting inventory based on sales starts with pulling the right data before you touch a formula. Most tools and guides converge on the same inputs.
Gather these before you forecast, because a forecast is only as good as what goes into it:
Once you have the data, convert dish-level sales into ingredient-level usage through your recipes. If you sold 200 burgers and each uses 150 g of beef, that is 30 kg of beef, and that ingredient number, not the dish count, is what you forecast and order against.
Four inputs do most of the work, and leaving one out is usually why a forecast drifts.
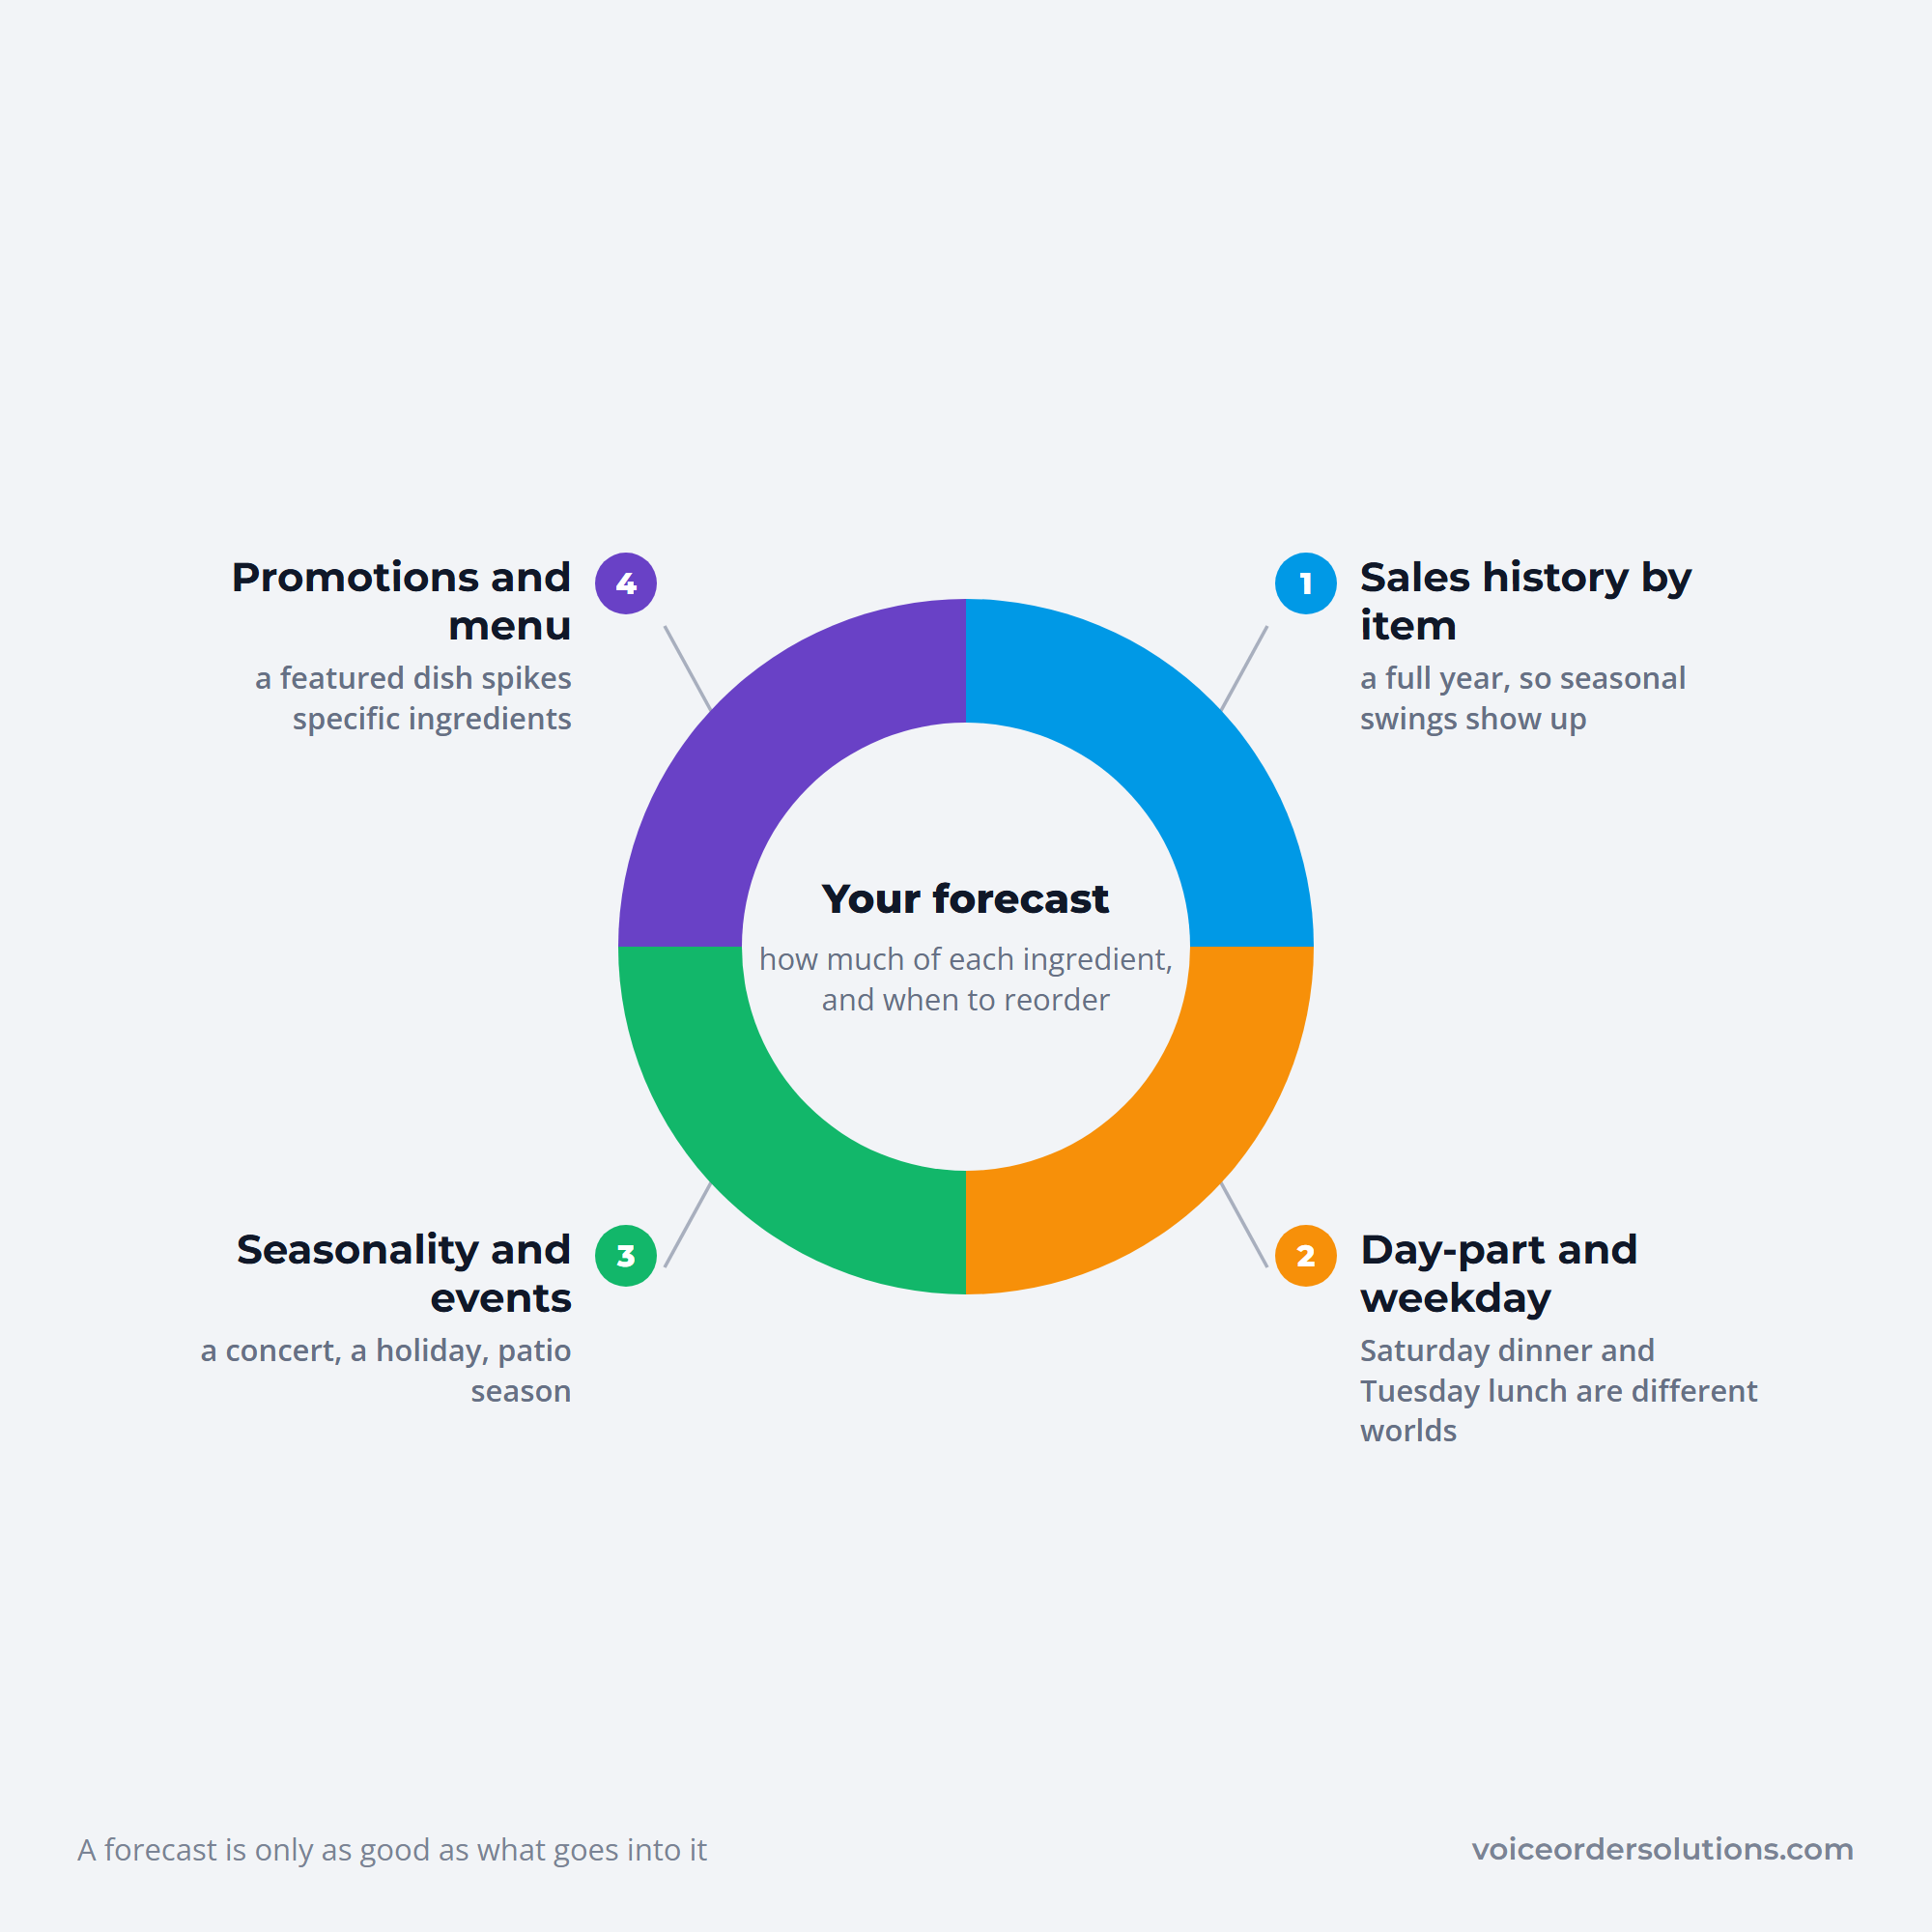
A simple method to start with is a moving average: take an item's usage over the last few comparable weeks to project the next one, then weight the most recent weeks more heavily when demand is clearly trending. It is basic, but it beats ordering on gut feel and gives you a number to refine as you go.
Clean sales data turned into ingredient usage, checked against a current restaurant inventory list, is what makes every formula in the next section trustworthy.
There are four core inventory forecasting techniques, and you do not need a data-science team to use them. Trend forecasting projects past direction forward, qualitative forecasting leans on staff judgment for new dishes with no history, quantitative forecasting runs the numbers from sales data, and graphical forecasting plots the pattern to spot seasonality by eye. Most kitchens blend them: numbers for the staples, judgment for the new special. Inventory planning software does the blending for you, reading real usage history instead of a spreadsheet you update by hand.
The judgment matters. As one supply-chain professional put it bluntly on Reddit, forecasting is "not a guessing game, it's math," and the right technique depends on the product: stable items use as much history as possible, trending items weight recent data, and new items borrow from a similar existing product. Match the method to the item and the forecast holds up.
A handful of formulas turn sales data into the numbers you actually order against. Here they are with a worked food example, using an item you use about 20 kg of per day on a two-day delivery cycle.
| Metric | Formula | Worked example |
|---|---|---|
| Lead-time demand | avg daily use × lead time | 20 kg × 2 days = 40 kg |
| Safety stock | (max daily × max lead) − (avg daily × avg lead) | (25 × 3) − (20 × 2) = 35 kg |
| Reorder point (par level) | lead-time demand + safety stock | 40 + 35 = 75 kg |
| Inventory turnover | COGS ÷ average inventory | a check on how lean you run |
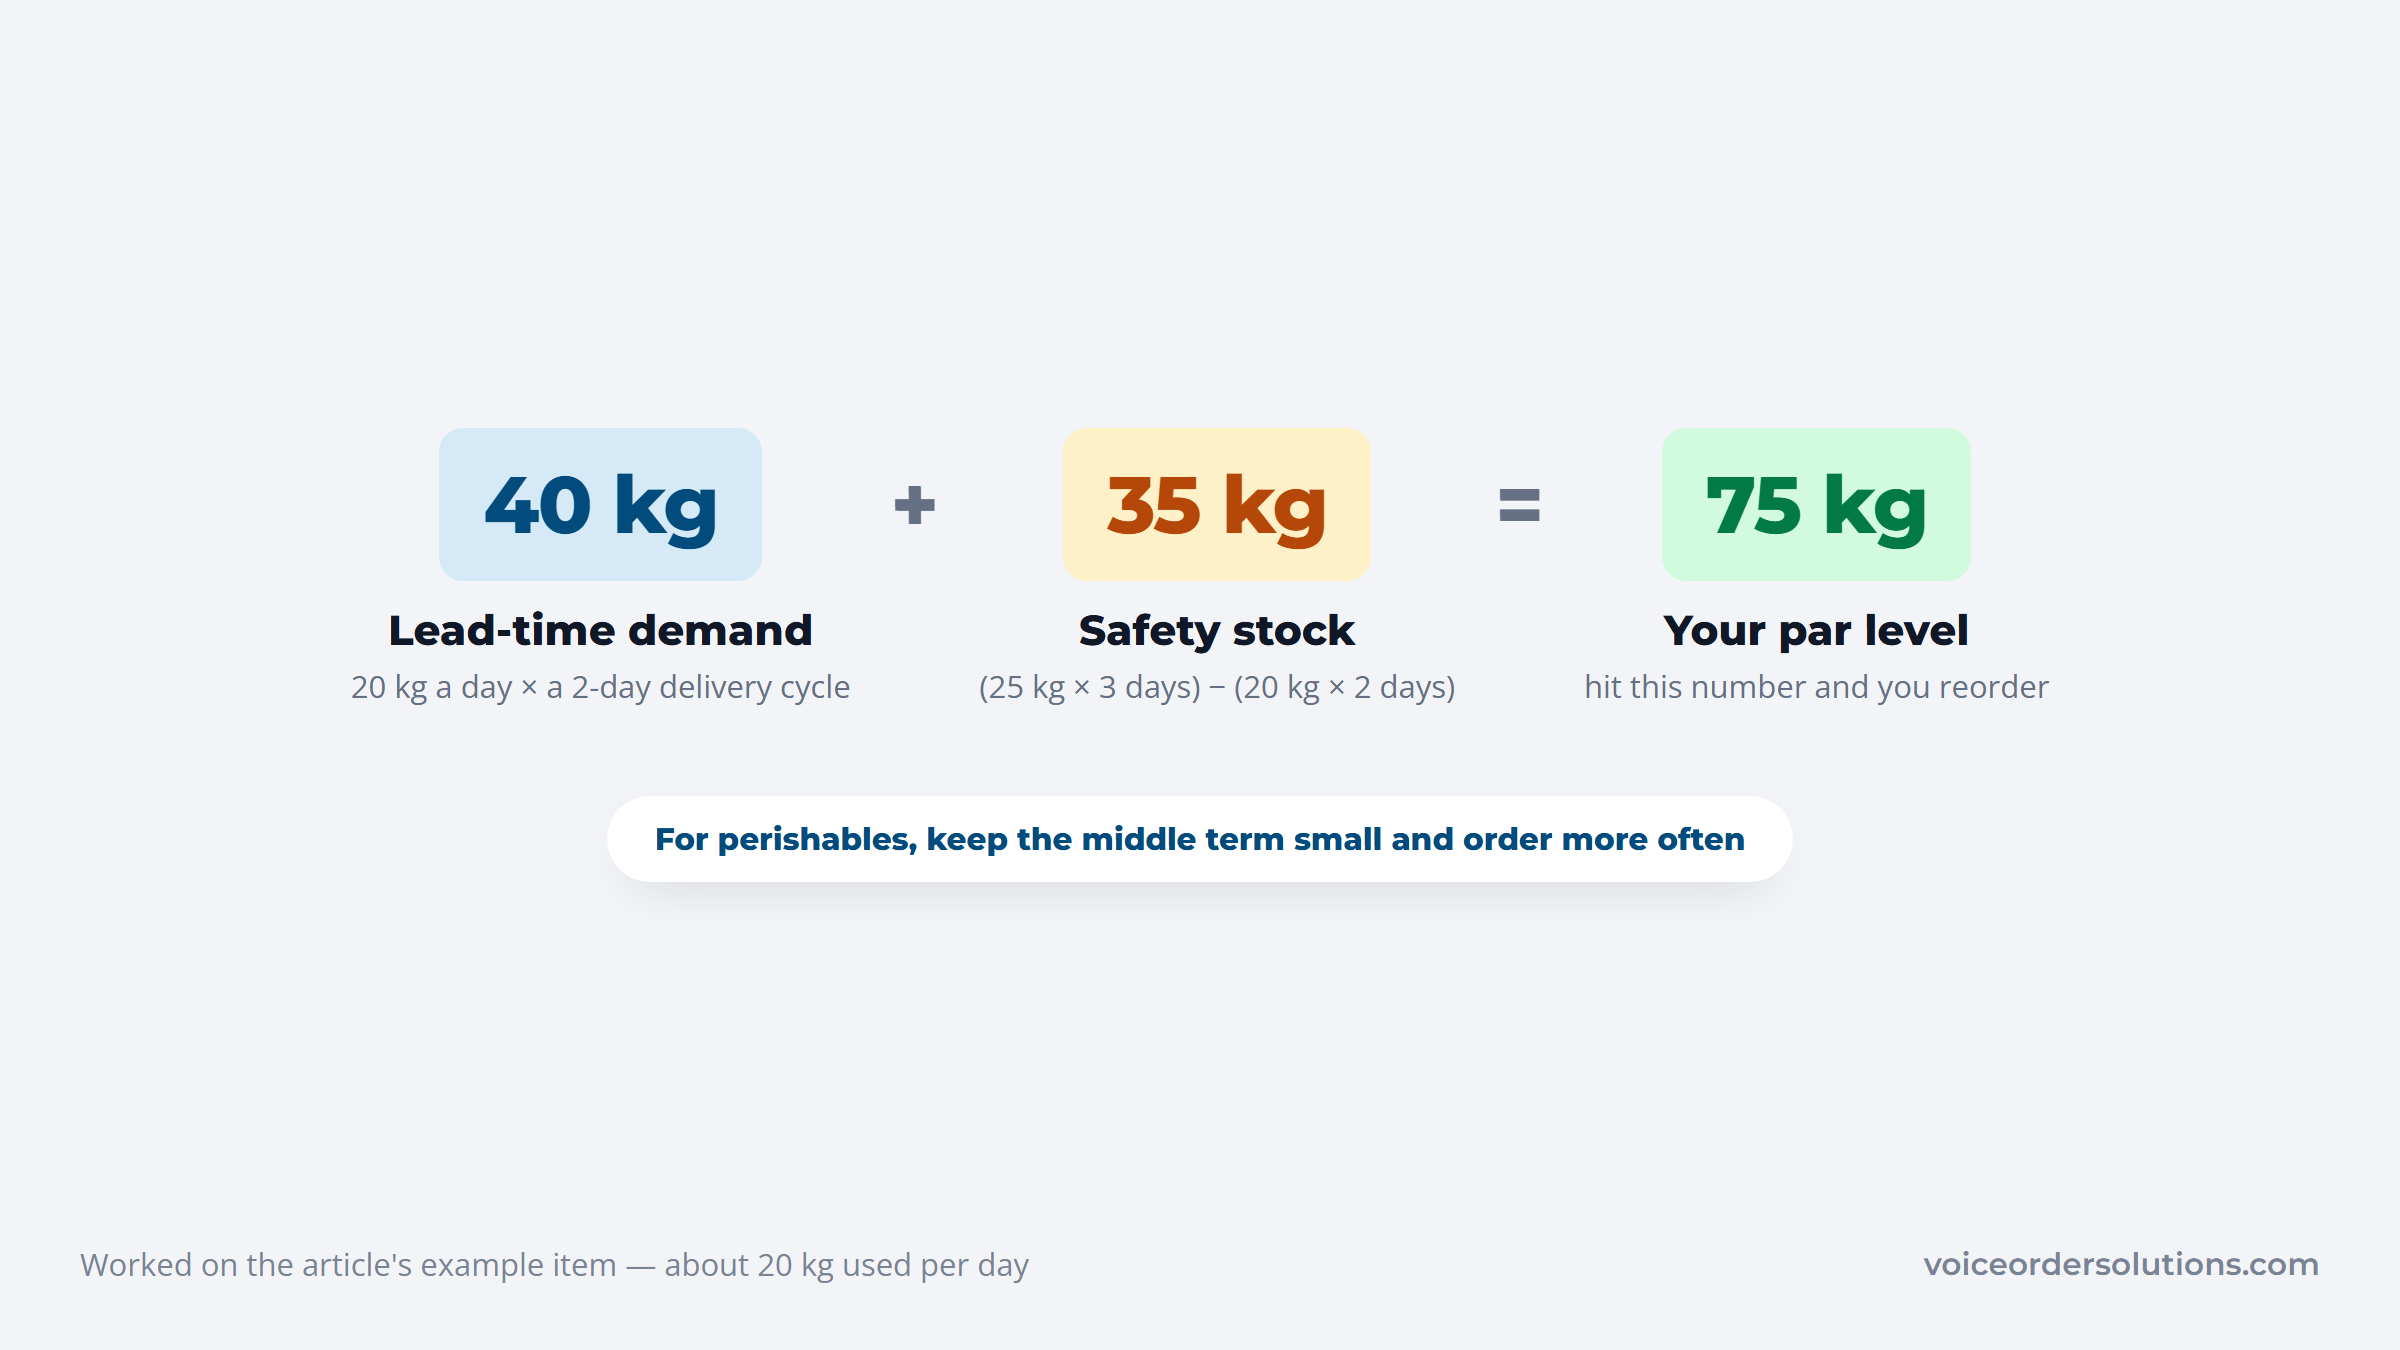
The reorder point is the number that matters day to day, and in a kitchen it goes by another name: the par level. When stock hits 75 kg, you reorder, and you should have just enough to cover the two-day lead time plus a buffer. Setting and holding those numbers is the day to day work of inventory control, and it decays quietly if nobody reviews it.
Broken into its two parts, the number stops looking like a formula and starts looking like a decision.
Economic order quantity (EOQ) answers a different question: how much to buy at once to minimize combined ordering and holding costs. It is the square root of (2 × annual demand × cost per order ÷ annual holding cost per unit).
For a dry good you use 6,000 kg a year, at a $20 cost per order and $2 per kg to hold, EOQ works out to about 346 kg. For perishables you cap that at what you can use before it spoils, which is exactly why food leans on frequent small orders instead of big ones.
Set these levels once from real data and forecasting inventory levels becomes a matter of updating them as demand shifts, not recalculating from scratch every week.
Your own pars will not match this example, so drop your case volumes, lead times, and shelf life into the calculator below to see where the buffer earns its keep and where it just sits in the cooler.
Work out how much buffer stock you need to stop running out, without tying up cash in product that spoils.
Demand for this SKU
Your supplier
Two numbers usually do the arguing here. Push the service level from 95% to 99% and watch how much cash the buffer swallows for a handful of avoided stockouts, then read the days of cover against your shelf life. If the buffer outlasts the product, it is not protection, it is shrink you have not booked yet.
Good forecasting is a routine, not a one-time calculation, and a few inventory forecasting best practices keep it accurate as demand moves. The 2026 shift across the industry is from static, monthly forecasts done by hand to continuous forecasts that update as sales come in, part of a wider move into restaurant automation, and the habits below work either way.
Build these into how you forecast, and revisit them on a schedule:
The perishable caveat runs through all of it: for short-shelf-life items, err toward tighter pars and more frequent orders rather than large safety stocks. Followed consistently, these practices keep a forecast honest, which is what makes the orders it drives smooth instead of reactive.
A forecast is only worth the order it produces. This is the step most guides skip: you have calculated that you need 30 kg of chicken and hit your reorder point, and now that number has to reach your distributor correctly. Forecasting sets the number; placing the order accurately is a separate job, and it is where accuracy quietly leaks.
The pattern that works is layering. One operator on Reddit described going from spreadsheets and simple averages at 60% to 70% forecast accuracy to around 85% to 90% after adding a dedicated forecasting layer on top of their base inventory system. The lesson generalizes: a base system tracks stock, a forecasting layer predicts need, and a final layer places the order. Each does one job well.
VoiceOrder Solutions is that final layer for the ordering step. It does not forecast demand or count your stock; your inventory system and forecast do that. What it does is turn "reorder 30 kg of chicken" into an accurate, placed order to the distributor without a re-typing error.
Here is how it closes the gap between a forecast and a clean order:
Because it layers on top of whatever inventory or forecasting tool you already run and goes live for independent distributors in 24 to 48 hours, it adds the accurate-ordering step without disrupting the rest. You can see how the ordering flow works on the VoiceOrder Solutions inventory management page. A tight forecast plus a clean order is what actually delivers smoother food orders, week after week.
Inventory forecasting is not one skill but a chain: predict demand, translate it into stock levels with a few reliable formulas, keep the forecast honest with real data and regular review, and then place the resulting order accurately. Skip any link and the others lose their value.
Start where the payback is fastest. Set par levels on your top-spend, most perishable items using last month's sales, and tighten how those reorders get placed so the right number actually reaches the distributor.
If manual, error-prone ordering is undoing your forecasting work, contact VoiceOrder Solutions to see how voice ordering turns an accurate forecast into an accurate order. The market will keep moving, but forecasting well against it, and ordering cleanly on top of that, is how you keep food orders smooth and waste low.
Inventory forecasting is predicting how much stock you will need over a future period, based on sales history, trends, and outside factors like seasonality and events. It is a distinct step from replenishment, which is placing the actual order. In a restaurant, forecasting in inventory management is what sets your par levels and reorder points so you meet demand without over-buying perishable stock.
Demand forecasting predicts what customers will buy, driven by the market, weather, and calendar. Inventory forecasting takes that prediction and works out the stock consequence: how much of each ingredient to hold and when to reorder. Demand forecasting in inventory management is the input; the inventory forecast is the output. When you run short, the two tell you whether demand was misjudged or the par level was set too low.
The four core inventory forecasting techniques are trend forecasting (projecting past direction forward), quantitative forecasting (running the numbers from sales data), qualitative forecasting (staff judgment for items with no history), and graphical forecasting (plotting patterns to spot seasonality). Most kitchens blend them, using data for staples and judgment for new dishes, and match the method to how stable or seasonal each item is.
Pull at least six months to a year of sales by item, break it down by day-part and day of week, and layer in seasonality, local events, and planned promotions. Then convert dish-level sales into ingredient usage through your recipes, so 200 burgers becomes 30 kg of beef. That ingredient-level number is what you forecast and order against, and it is only reliable if the underlying sales data is clean.
Use six months to two years of history, strip out anomalies like one-off catering orders, and apply the 80/20 rule by forecasting your highest-spend items precisely. Build in known promotions and holidays, and reforecast on a cadence, weekly for fast-moving or seasonal items. For perishables specifically, keep safety stock tight and order more frequently rather than holding large buffers that spoil.