For Independent Food Distributors

Inventory Turnover Ratio Calculator

See how many times a year you turn your stock, how long a case sits before it sells, and the cash a slow turn ties up.
VoiceOrder app ordering screen

Inventory Turnover Calculator

See how many times a year you turn your stock, how long a case sits before it sells, and the cash a slow turn ties up.

Your numbers

$
What the product you sold cost you, at cost, over a year.
$
Typical stock value at cost, not retail.
% / yr
Storage, spoilage, insurance and tied-up cash, usually 20 to 30%.
days
Trim days of stock and see the cash it frees.
Inventory turnover
12.0x
COGS divided by average inventory
Days inventory outstanding
30.4 days
How long a case sits before it sells
Cash tied up in stock
$132,000
Your average inventory at cost
Annual carrying cost
$33,000
At 25% of inventory value
Cash freed by turning faster
$21,699
By trimming 5 days of stock
Carrying cost saved
$5,425
Every year, on that freed cash
You turn inventory 12.0 times a year, so a case sits about 30 days before it sells. That parks $132,000 in stock and costs about $33,000 a year to carry at 25%. Turning 5 days faster would free $21,699 and save $5,425 a year in carrying.
Slow turns start with stock nobody ordered. VoiceOrder Solutions keeps inventory live and orders confirmed, so you buy to demand and turn the shelf faster.
Book A Demo →
Estimates only. Use COGS and inventory at cost from the same period for a clean turnover number.
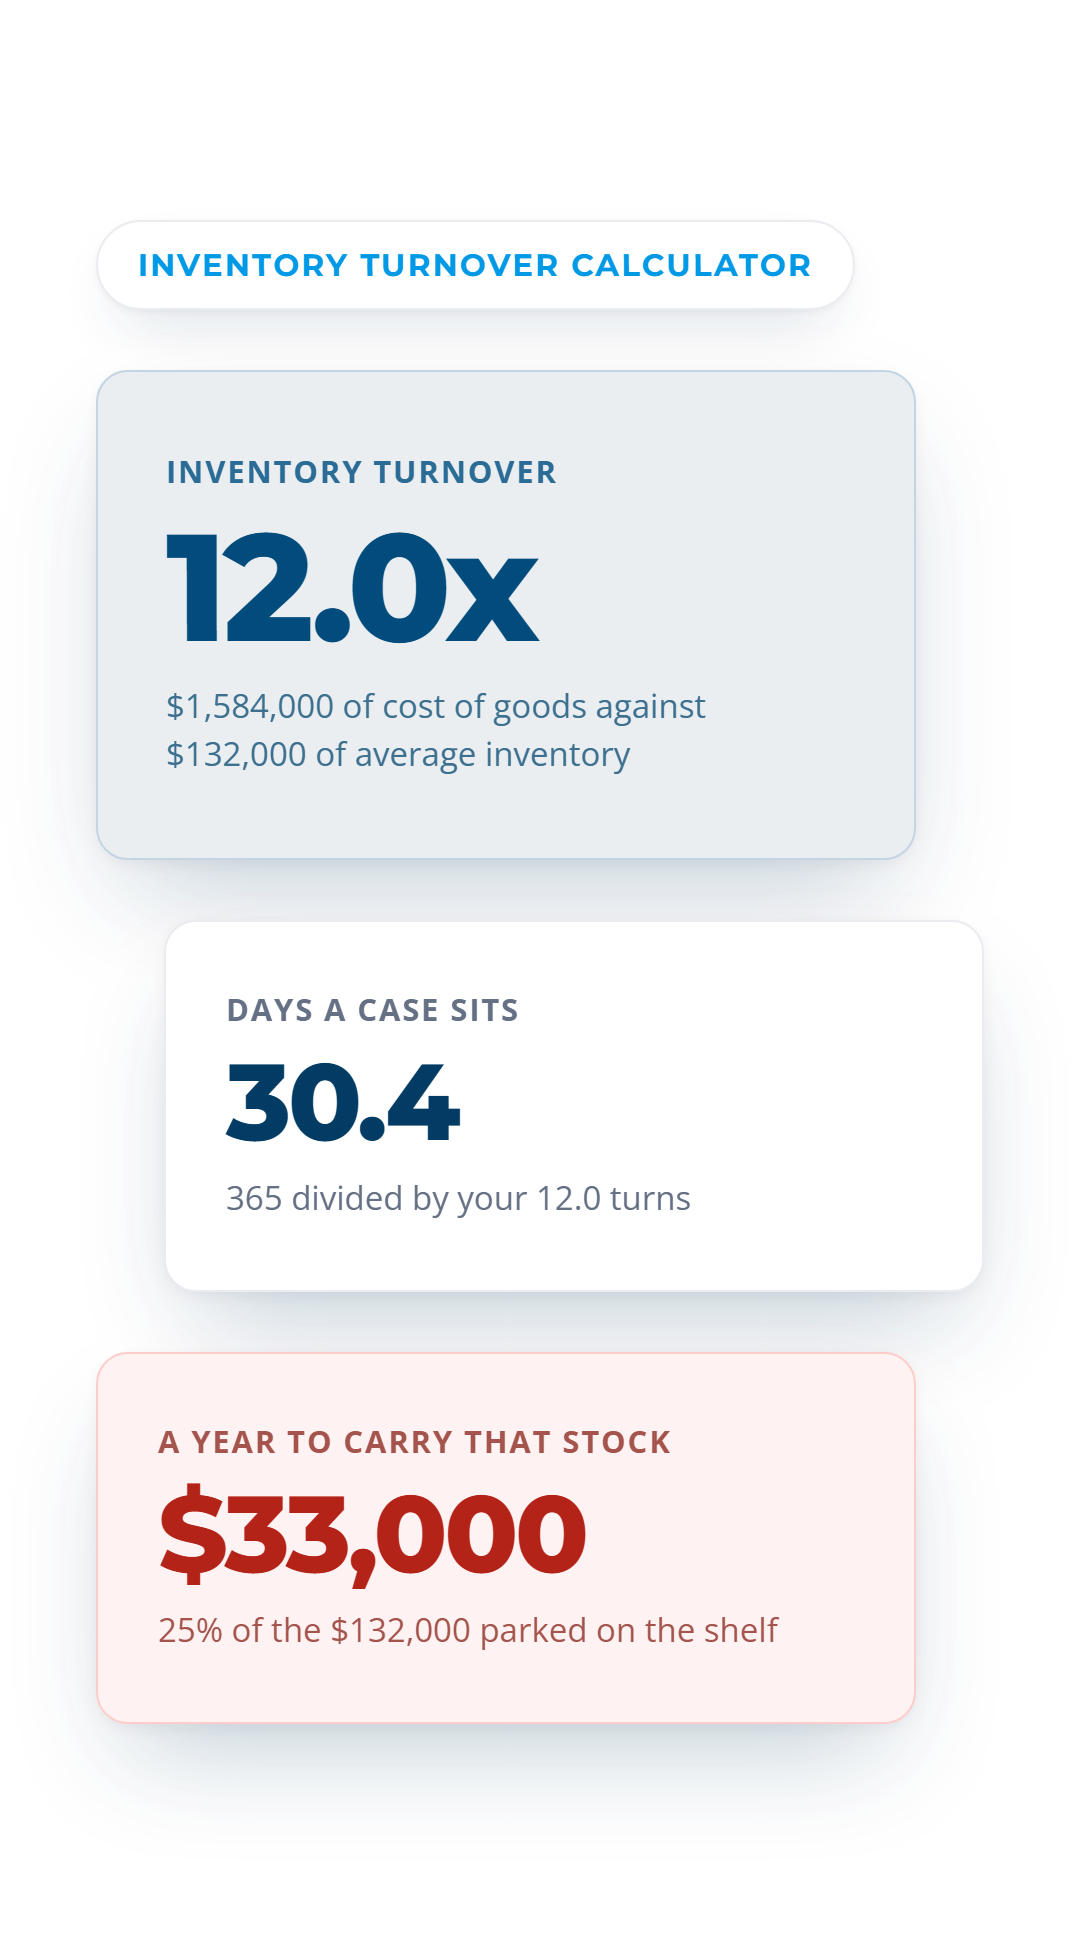
12.0x

Times you turn stock in a year

30.4

Days a case sits before it sells

$33,000

A year to carry that stock

Sound Familiar?

The stock is paid for, so nobody counts what it costs

Inventory does not look like an expense once the invoice is paid. It keeps costing you every week it sits.
Deep pallet racking for carrying extra depth so no order is missed

We keep depth so we never miss an order.

Depth is insurance, and insurance has a price. At 25% a year, the $132,000 on your shelf costs $33,000 to hold, whether it moves or not.
Warehouse building for turns treated as a floor number, not finance

Turns are a warehouse number, not a finance one.

Turning 12.0 times a year means a case sits about 30 days. Every one of those days is cash you cannot spend on the accounts you are trying to win.
Dollar sign for the cash that five days of inventory either way frees

Five days either way makes no difference.

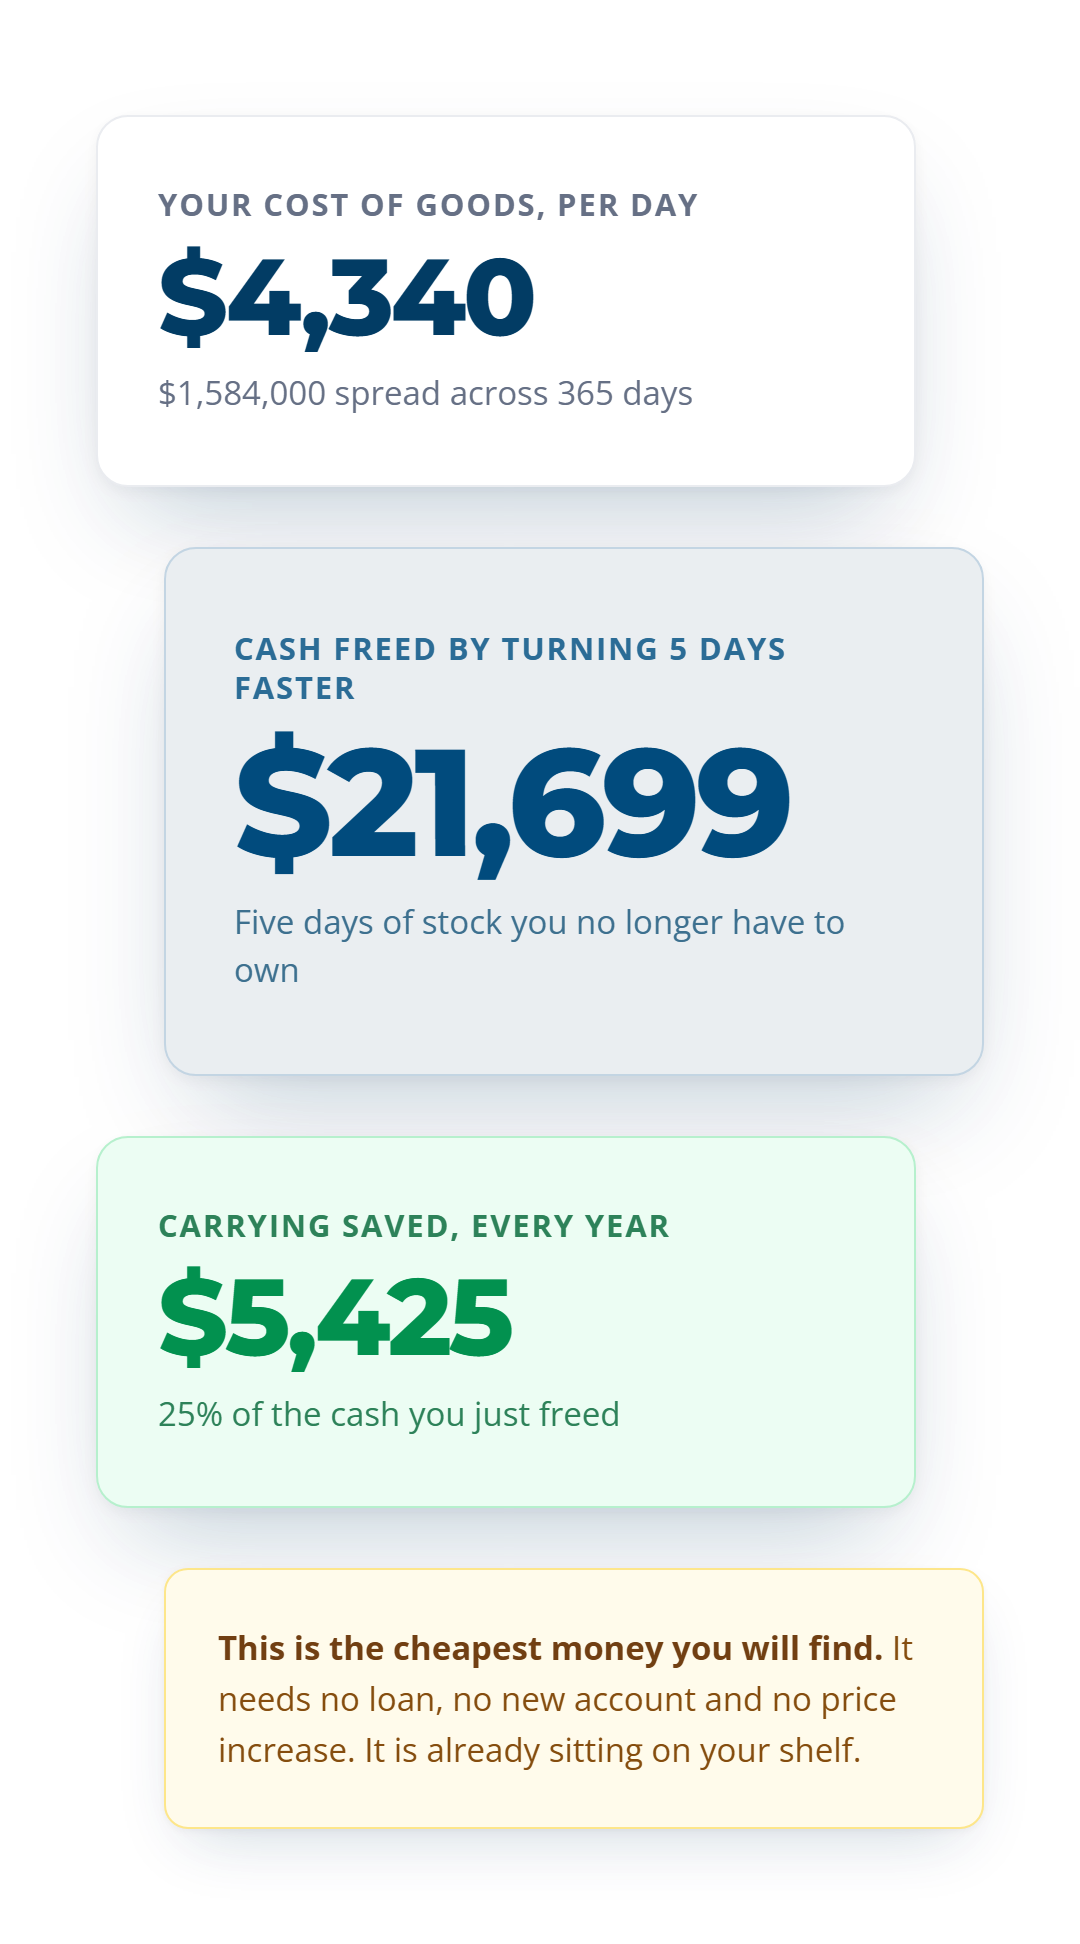
Five days is $21,699 at this volume, plus $5,425 a year in carrying. It is the cheapest money you will find, and it is already yours.
How It Works

How to use the inventory turnover calculator

Two numbers off your own books, then a slider to see what a faster turn is worth.
1

Enter annual cost of goods sold

Use cost, not revenue. Turnover measured against sales flatters you, because it counts your margin as stock movement.
2

Enter your average inventory

Average the month-end values across the year, at cost. A single snapshot taken after a big buy will tell you the wrong story.
3

Pull the slider and read the cash

Trim five days and the calculator shows $21,699 freed and $5,425 a year saved. That is the size of the prize before you change anything.
Built For Distributors

What the calculator shows you

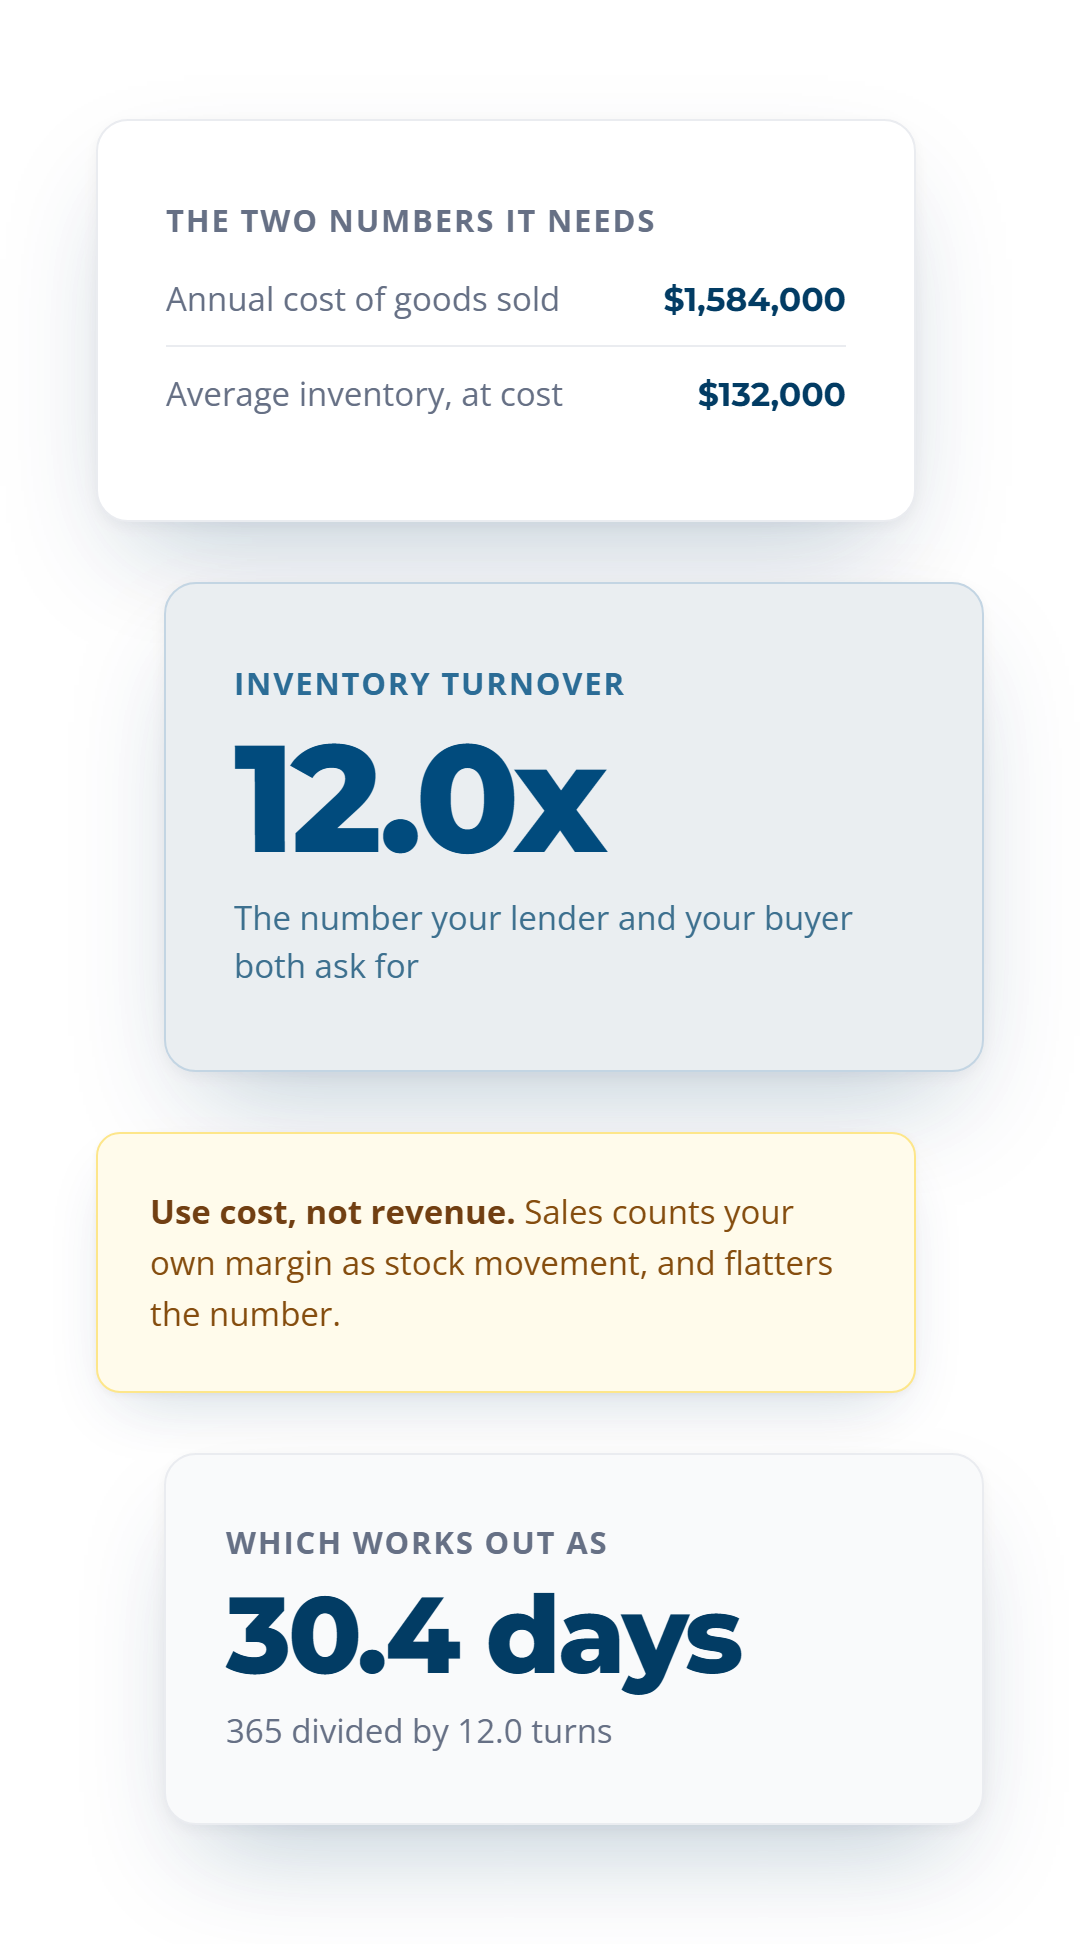
Inventory turnover worked out: $1,584,000 of annual cost of goods divided by $132,000 of average inventory gives 12.0 turns, or 30.4 days on hand.
Turnover

How many times a year you actually turn

Cost of goods sold divided by average inventory. $1,584,000 against $132,000 is 12.0 turns, which is the number your lender and your buyer both want.
Uses cost of goods, not revenue
Works off average inventory, not a snapshot
Gives one number you can track monthly
Compares cleanly against last year
Days on hand

How long a case sits before it sells

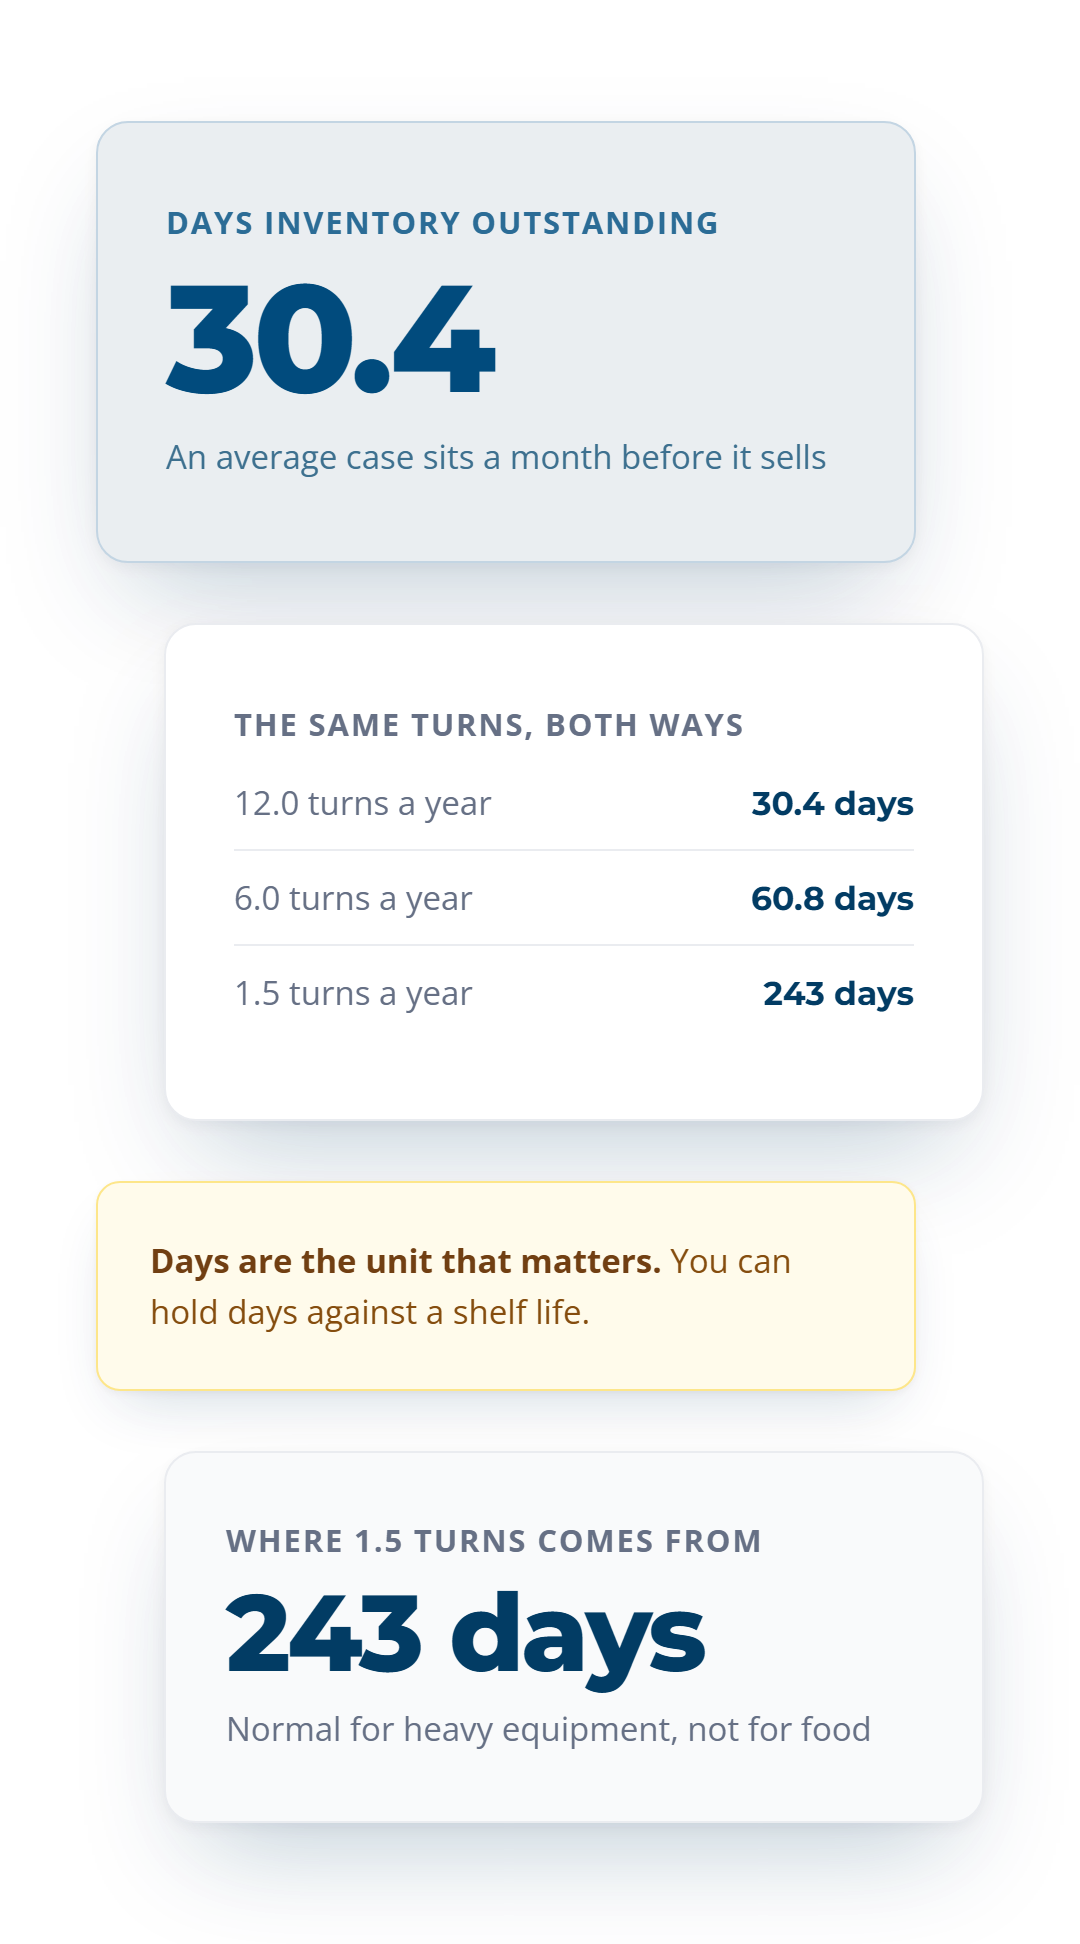
Turns are abstract, days are not. 12.0 turns is 30.4 days, and on a short-dated item that number has to sit well inside the shelf life.
Converts turns into days you can picture
Lets you set a days-of-cover target
Flags stock that outlives its shelf life
Reads the same way across categories
Turns expressed as days on hand: 12.0 turns is 30.4 days, 6.0 turns is 60.8 days, and 1.5 turns is 243 days.
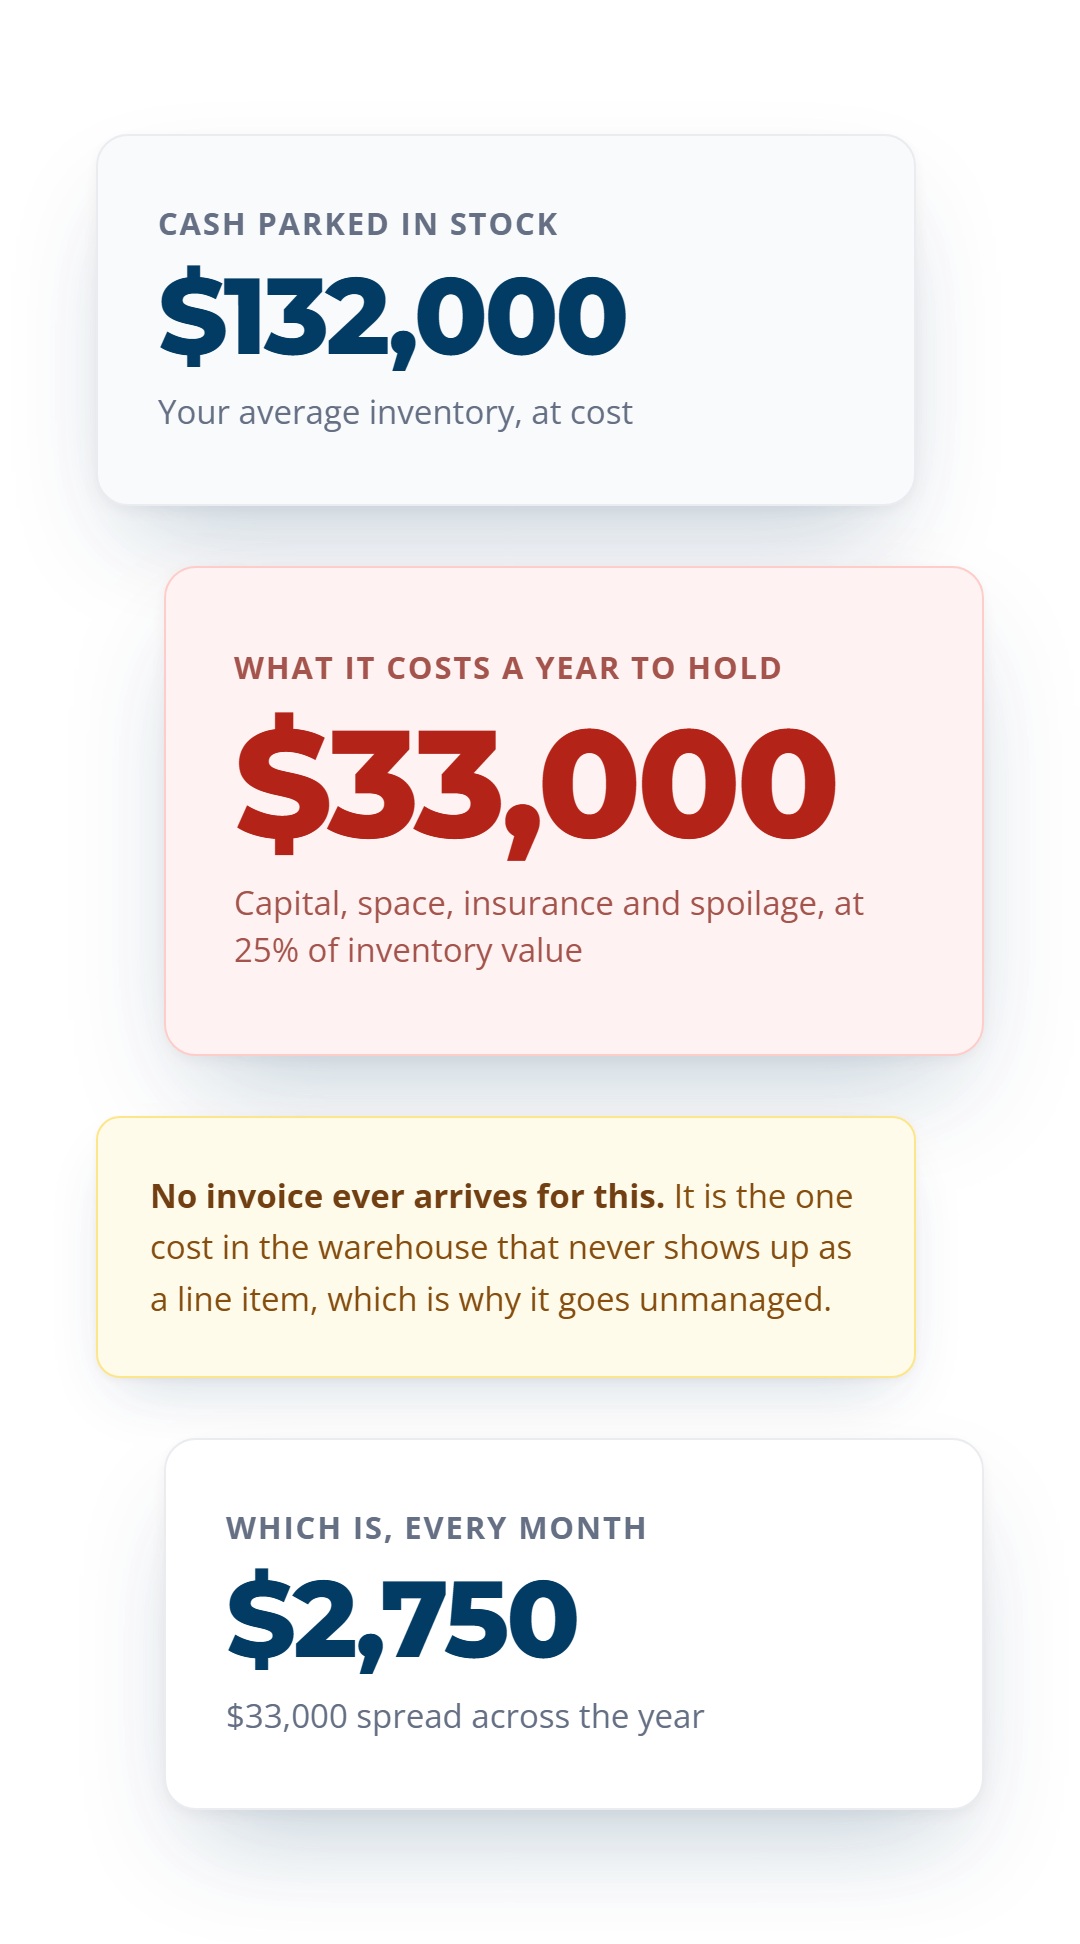
$132,000 of cash parked in stock costs $33,000 a year to carry at 25 percent, which is $2,750 a month.
Cash and carrying

What the shelf costs you to hold

$132,000 sits in stock, and carrying it at 25% costs $33,000 a year in capital, space, insurance and spoilage. None of it shows up as a line item.
Prices the cash parked on your shelf
Applies your own carrying rate
Makes a hidden cost a visible one
Updates as your inventory moves
The prize

What five days faster is worth

Your daily cost of goods is $4,340, so five days of stock is $21,699. Free it and you also stop paying $5,425 a year to carry it.
Turns a days target into a cash figure
Adds the carrying cost you stop paying
Slides from one day to a month
Gives you a number to take to the bank
At $4,340 of cost of goods a day, turning five days faster frees $21,699 of cash and saves $5,425 a year in carrying cost.
After The Numbers

What to do once you know your turns

A turnover number is only useful if it changes what you buy next week. Start here.
Target icon for setting a days of cover target

Set a days-of-cover target

Bar comparison icon for ranking SKUs by days on hand

Rank SKUs by days on hand

Downward trend icon for cutting the slowest tenth of SKUs

Cut the slowest tenth first

Balance scale icon for buying to demand instead of to deals

Buy to demand, not to deals

Calendar icon for checking turns against shelf life

Check turns against shelf life

Turnover cycle icon for tracking turns every month

Track turns every month

Clock icon for shortening your own lead times

Shorten your own lead times

Shrink icon for reviewing dead stock quarterly

Review dead stock quarterly

Cash icon for putting the freed cash to work

Put the freed cash to work

Six Levers

What actually moves your turns

Turnover is an output. These are the six inputs underneath it that you can change.
Order guide icon for order frequency

Order frequency

Smaller, more frequent buys hold less on the shelf for the same annual volume.
Delivery truck icon for supplier lead time

Supplier lead time

Every day of lead time is a day of cover you have to hold. Shorter lead times turn faster.
Rising chart icon for demand visibility

Demand visibility

Knowing what your accounts order, and when, is what lets you hold less without missing.
Price tag icon for deal buying

Deal buying

A discount that doubles your days on hand costs more in carrying than it saved on cost.
Stacked cases icon for SKU count

SKU count

Every added SKU needs its own cover. The slowest tenth usually holds the most cash.
Verified check icon for order accuracy

Order accuracy

A wrong order becomes stock nobody asked for, and it sits longer than anything you chose.

See how VOS keeps inventory visible as order activity changes

VoiceOrder Solutions shows live inventory against the catalog your accounts order from, and every order arrives digitized, numbered and timestamped.
The Comparison

Three ways to decide how much stock to hold

Same $1,584,000 of annual cost of goods. This is what each approach does to the shelf and to the cash.

What you need from a stock level

Buy to demand

Hold deep cover

Order by habit

Frees cash you can actually use
No, it parks more of it
No, and you cannot say why
Keeps carrying cost down
No, 25% of a bigger number
Unpredictable either way
Keeps stock inside its shelf life
No, older stock sits longest
Only by luck
Gives you a number to manage to
Yes, but the number gets worse
No, there is no target
Tells you which SKUs to cut
No, depth hides the slow ones
No
Holds up when demand moves
Yes, that is what it buys you
No, a swing becomes a shortage
Scales as you add accounts
Costs more with every account
No, it gets worse with scale
Shows up in your turnover
Yes, it lowers them
Yes, as a number nobody reads
Where it falls down
Needs you to know what accounts will order
You pay $5,425 a year per 5 days held
Nobody notices until cash is tight
Best used for
The default once demand is visible
Long lead times and volatile demand
Nothing, it is just what happens
FAQ

Common questions about inventory turnover

How do I calculate inventory turnover ratio?
Divide annual cost of goods sold by average inventory, both at cost. $1,584,000 of cost of goods against $132,000 of average inventory gives 12.0 turns a year.
What is the turnover ratio formula?
Turnover equals cost of goods sold divided by average inventory. For days, divide 365 by the turnover: 365 divided by 12.0 is 30.4 days on hand.
Is 1.5 a good inventory turnover ratio?
Not for food distribution. At 1.5 turns a case sits about 243 days, which is far past the shelf life of most of what you carry. That figure comes from slower industries like heavy equipment.
How many times should inventory be turned over per year?
It depends on what you carry. Dry goods and canned stock often run 10 to 15 turns, while fresh and short-dated items need far more. Compare against your own last year before any benchmark.
What is days inventory outstanding?
The number of days an average case sits before it sells, which is 365 divided by your turnover. It is the same measure as turns, in a unit you can match against shelf life.
What does slow inventory actually cost?
Capital, space, insurance, spoilage and obsolescence. The 25% in the field is only a placeholder. Build the rate from your own five lines, as the inventory carrying cost calculator does, and it comes to 27%. The same $132,000 then costs $35,640 a year, not $33,000.
How is this different from accounts receivable turnover?
Inventory turnover measures how fast stock leaves the warehouse. Accounts receivable turnover measures how fast customers pay you for it. Both park cash, in different places.

Turn the shelf, not the guesswork

VoiceOrder Solutions keeps inventory visible against live order activity and sends every order in digitized and confirmed, and most distributors are live in 24 to 48 hours.